
1 Introduction
In 2022, global production of red macroalgae was estimated at approximately 20.38 million tons (FAO, 2024). Within this group, the genera Eucheuma and Kappaphycus, collectively referred to as eucheumatoids, are of major economic importance because of their carrageenan content (Zhang et al., 2023). This high-value hydrocolloid is widely used in the food industry for its gelling, thickening, and stabilising properties (Hurtado et al., 2017). Although Asia overwhelmingly dominates global production, Eastern Africa has emerged as the principal carrageenophyte-producing region on the African continent, with Zanzibar (Tanzania) and Madagascar as its main production centres (Hayashi et al., 2017). In Madagascar, the main cultivated carrageenophytes are Kappaphycus alvarezii (commonly known as cottonii; hereafter referred to as Kappaphycus), Kappaphycus striatus, and Eucheuma denticulatum. In 2020, national export volumes reached 17,000 t fresh weight (FW) for Kappaphycus and 3,000 t FW for Eucheuma (Msuya et al., 2022). Since these estimates, production has reportedly increased, largely driven by the expansion of private companies such as Nosy Boraha Seaweed (NBS) and Sovalg in the Sainte-Marie lagoon (Urbina-Barreto et al., 2026). With an export biomass of 22,000 t FW of Kappaphycus in 2025, it is now the leading production area, accounting for 43% of national production (S. Jan, pers. comm.).
In Eastern Africa, the cultivation method uses off-bottom and long-line systems with a relatively short cultivation cycle ranging from 35 to 45 days, which is one of the main reasons for its economic attractiveness to small-scale farmers (Msuya et al., 2022; Urbina-Barreto et al., 2026). The NBS company, which has developed an innovative community-based aquaculture model, coordinates the management of off-bottom cultivation plots (each plot is 40x12.5 m, with 100 cultivation lines) operated by approximately 120 farmers. Five technicians conduct weekly visual inspections to assess harvest readiness across more than 700 cultivation plots, covering a farming area of nearly 300 ha. At the end of the cultivation cycle, biomass can vary substantially among plots, typically ranging from 2 to 3 tons FW per plot. Given the scale of production, visual errors in plot-level biomass assessment can propagate into substantial uncertainty in total harvest estimates. To address this challenge, the company seeks to optimise harvesting through precision farm-management techniques (Vadassery and Neish, 2024). In this context, drones (Unoccupied Aerial Vehicle, UAV) offer a promising solution, as they can acquire highly detailed data at low altitudes that can be processed with machine-learning algorithms to produce high-precision maps (Joyce et al., 2023; Oiry et al., 2025).
The use of drones has already been demonstrated as an effective approach for mapping Kappaphycus cultivation in regions such as Brazil, Indonesia, and Madagascar (Innocentini et al., 2024; Nurdin et al., 2025; Urbina-Barreto et al., 2026). Their ultra-high spatial resolution, far exceeding that of satellite imagery, together with their operational flexibility for on-demand data acquisition, enables the mapping of areas in ways that satellites cannot achieve (Langford et al., 2021; Setyawidati et al., 2017). While drone-based multispectral sensors allow for detailed characterisation of target reflectance and can enhance the discrimination of vegetation types, their use typically involves complex processing workflows, large data volumes, and substantial computational requirements. These constraints limit their accessibility and operational deployment, particularly for non-expert users and private companies seeking simple, robust, and cost-effective monitoring solutions. At very high spatial resolution, RGB imagery can nevertheless provide sufficient information to discriminate targets of interest within complex environments (Román et al., 2026). In Madagascar, Urbina-Barreto et al. (2026) showed that RGB imagery combined with Random Forest classification can accurately discriminate cultivated Kappaphycus. However, despite these promising results, there remains a need for simplified, transferable, and operational workflows based on RGB drone imagery that can be readily adopted by non-expert users for routine monitoring of seaweed farming systems.
** The objective of this study is to develop an operational drone-based approach for estimating Kappaphycus biomass at the cultivation-plot scale prior to harvest. Using RGB imagery acquired during routine farming operations in the Sainte-Marie lagoon (Madagascar), we investigate the capacity of drone-derived information to predict biomass and support precision monitoring. In addition, we aim to translate this approach into a standalone, open-source, user-friendly application directly accessible to aquaculture professionals.
2 Materiels & Methods
2.1 Study site
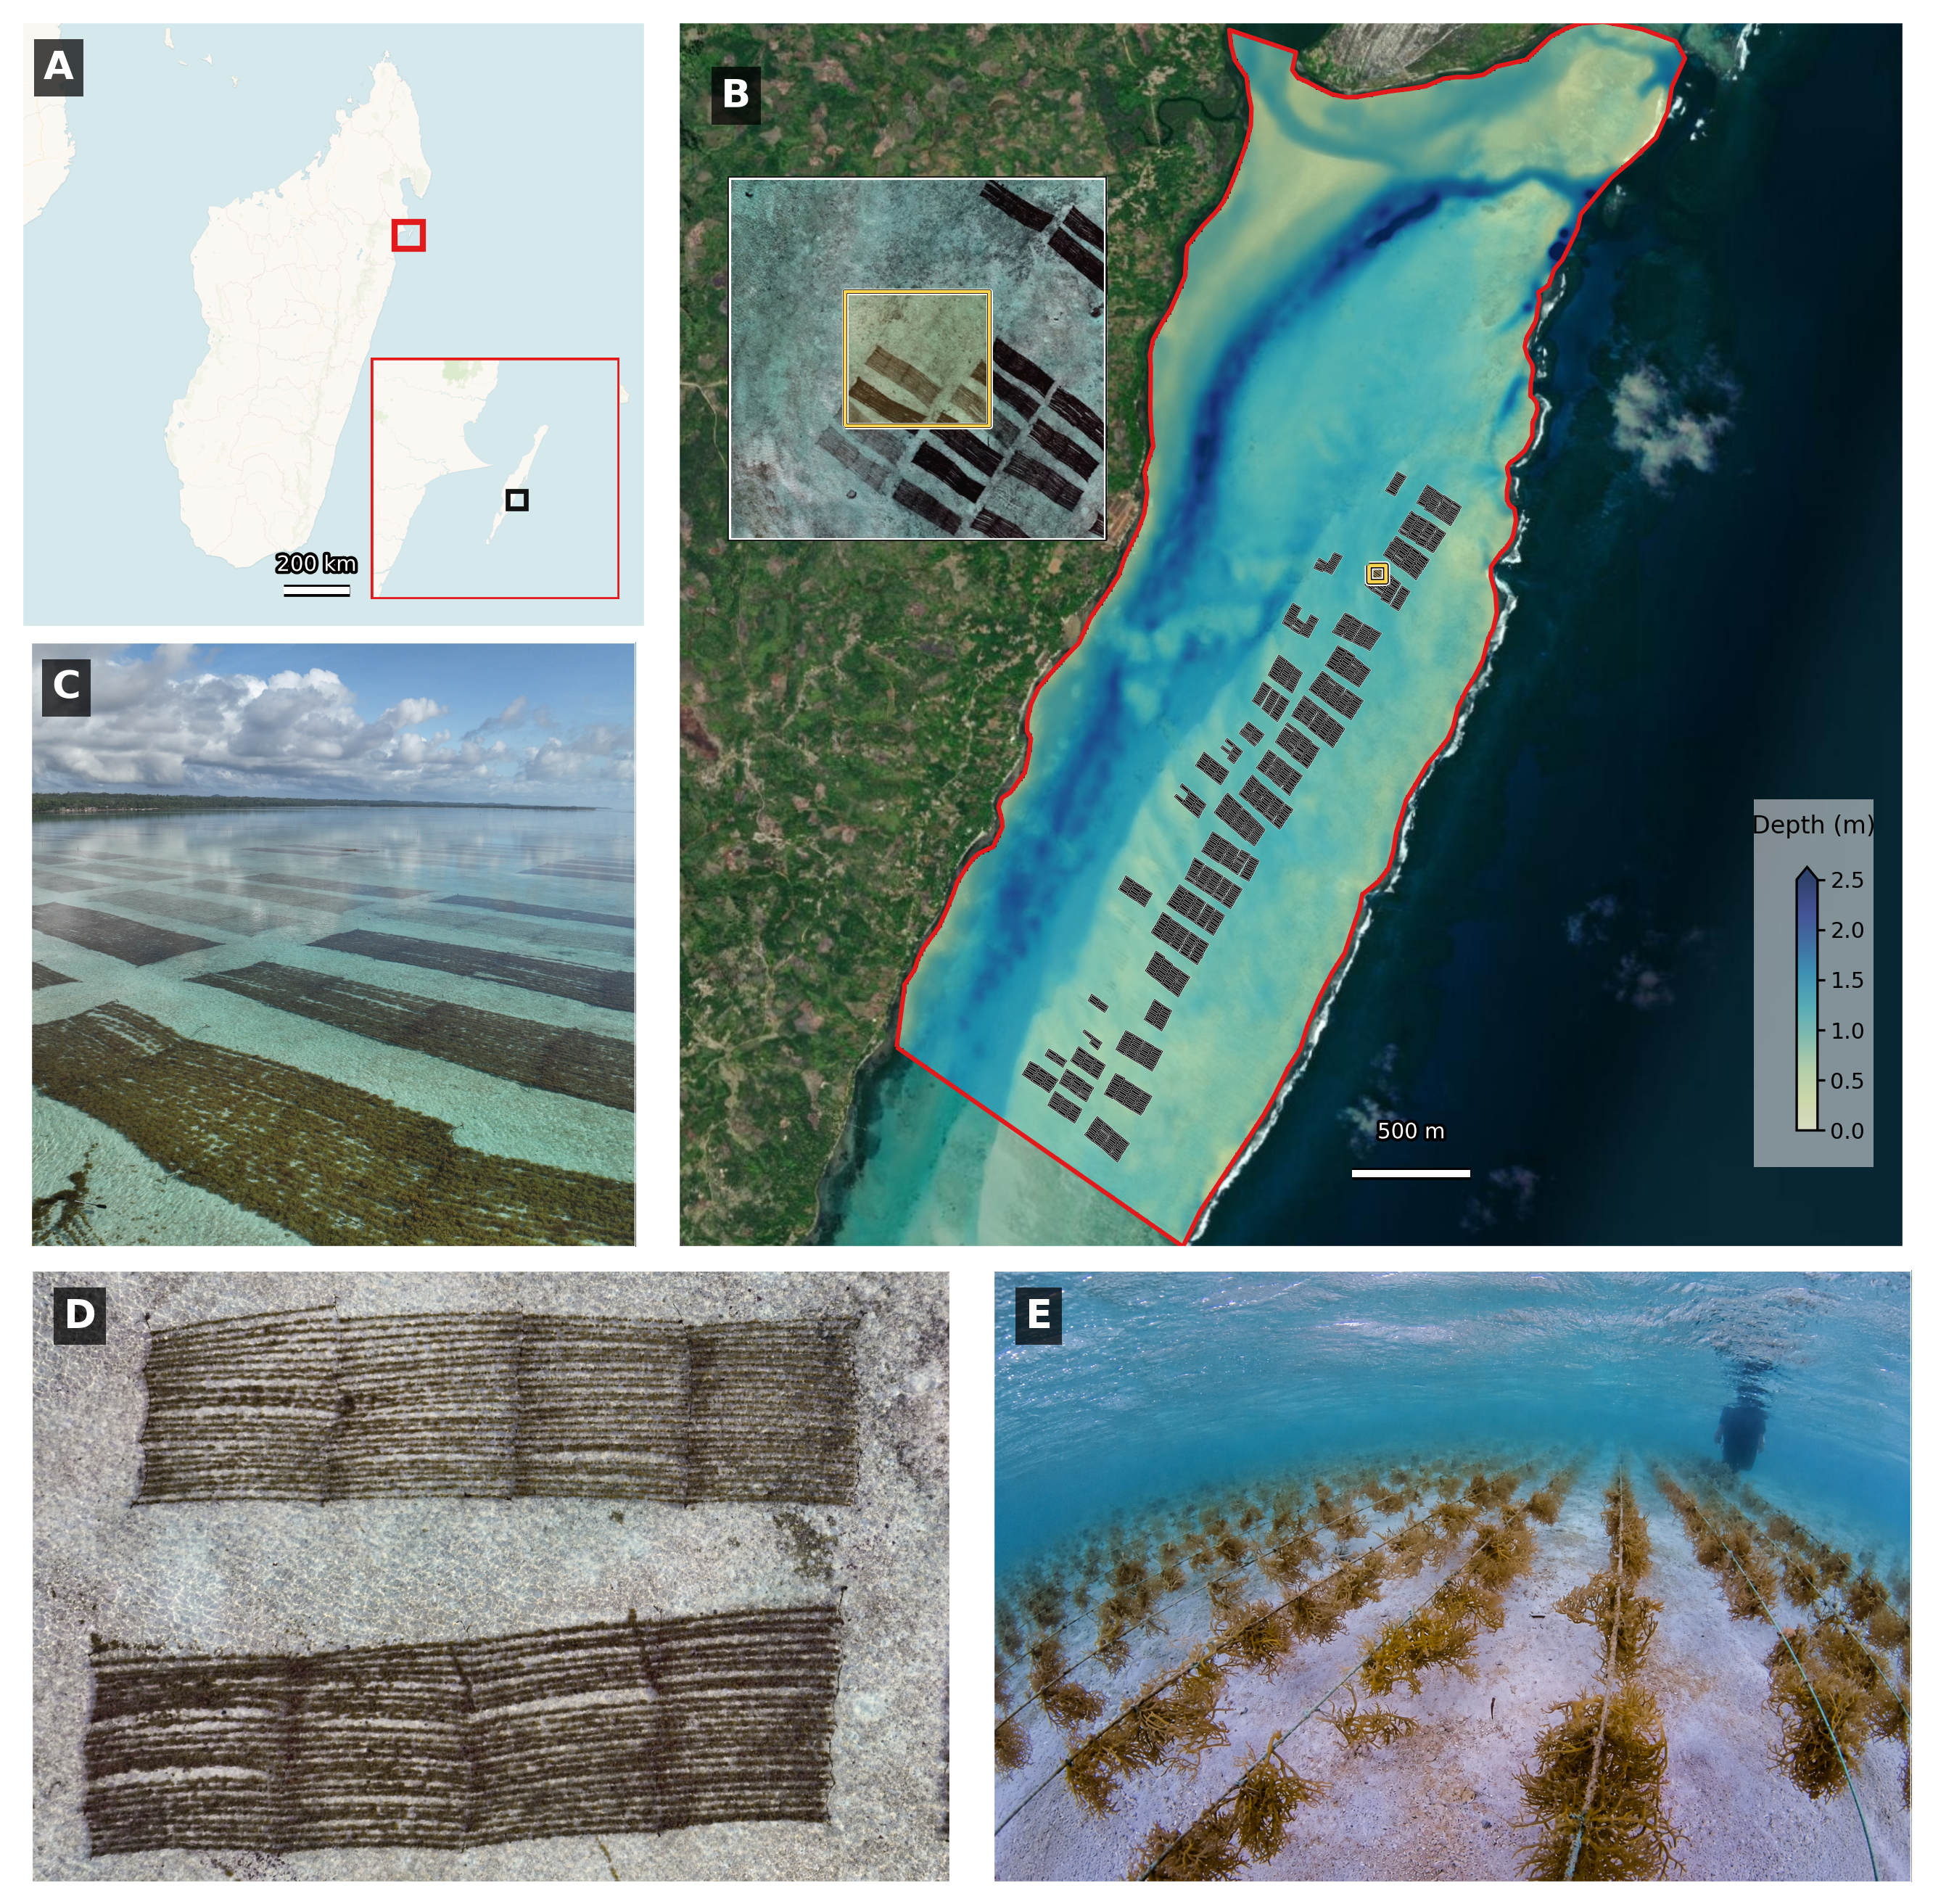
Sainte-Marie (also known as Nosy Boraha) is a small island located off the east coast of Madagascar in the Indian Ocean (Figure 1 A & B). The study area is situated near the village of Ankobahoba, on the eastern side of the island, within a narrow (15 km long × 1.5 km wide) and very shallow lagoon. Water depths generally range from <1 to 5 m in channels at low tide (Figure 1 C). The lagoon is enclosed by a barrier reef and connected to the open ocean through several reef passes. Its total water volume is ca. 30.3 million cubic meters. Substrates are dominated by sand and coral rubble, supporting seagrass meadows, macroalgal beds, and patch reefs, which become increasingly frequent toward the reef front.
Aquaculture represents a major and expanding use of the eastern lagoon, where seaweed farming has become a key component of coastal livelihoods. The activity is dominated by the cultivation of Kappaphycus alvarezii (“cottonii”), primarily concentrated in the northern sector of the lagoon. Farming is conducted using off-bottom longline techniques adapted to very shallow environments (Figure 1 D-F). Individual cultivation lines are approximately 10 m long and are arranged in plots comprising 100 lines, forming units of approximately 10 m × 40 m. A farm typically consists of six adjacent plots managed by a single farmer. Farm are grouped by 4 or 5 to form a cultivation block. The Nosy Boraha Seaweed company (NBS) is coordinating the management of 726 cultivation plots in the lagoon. While this activity provides an important alternative source of income amid declining fish stocks, it also contributes to increased spatial competition with traditional fishing practices within this confined coastal system.
More broadly, the lagoon is now included within the newly established AMTP Sorkay (Marine and Terrestrial Protected Area), a large-scale conservation initiative (~265,000 ha) aimed at preserving the island’s marine biodiversity and promoting sustainable resource management through community-based governance.
2.2 Data collection & pre-processing
2.2.1 Freshweight of harvested seaweed
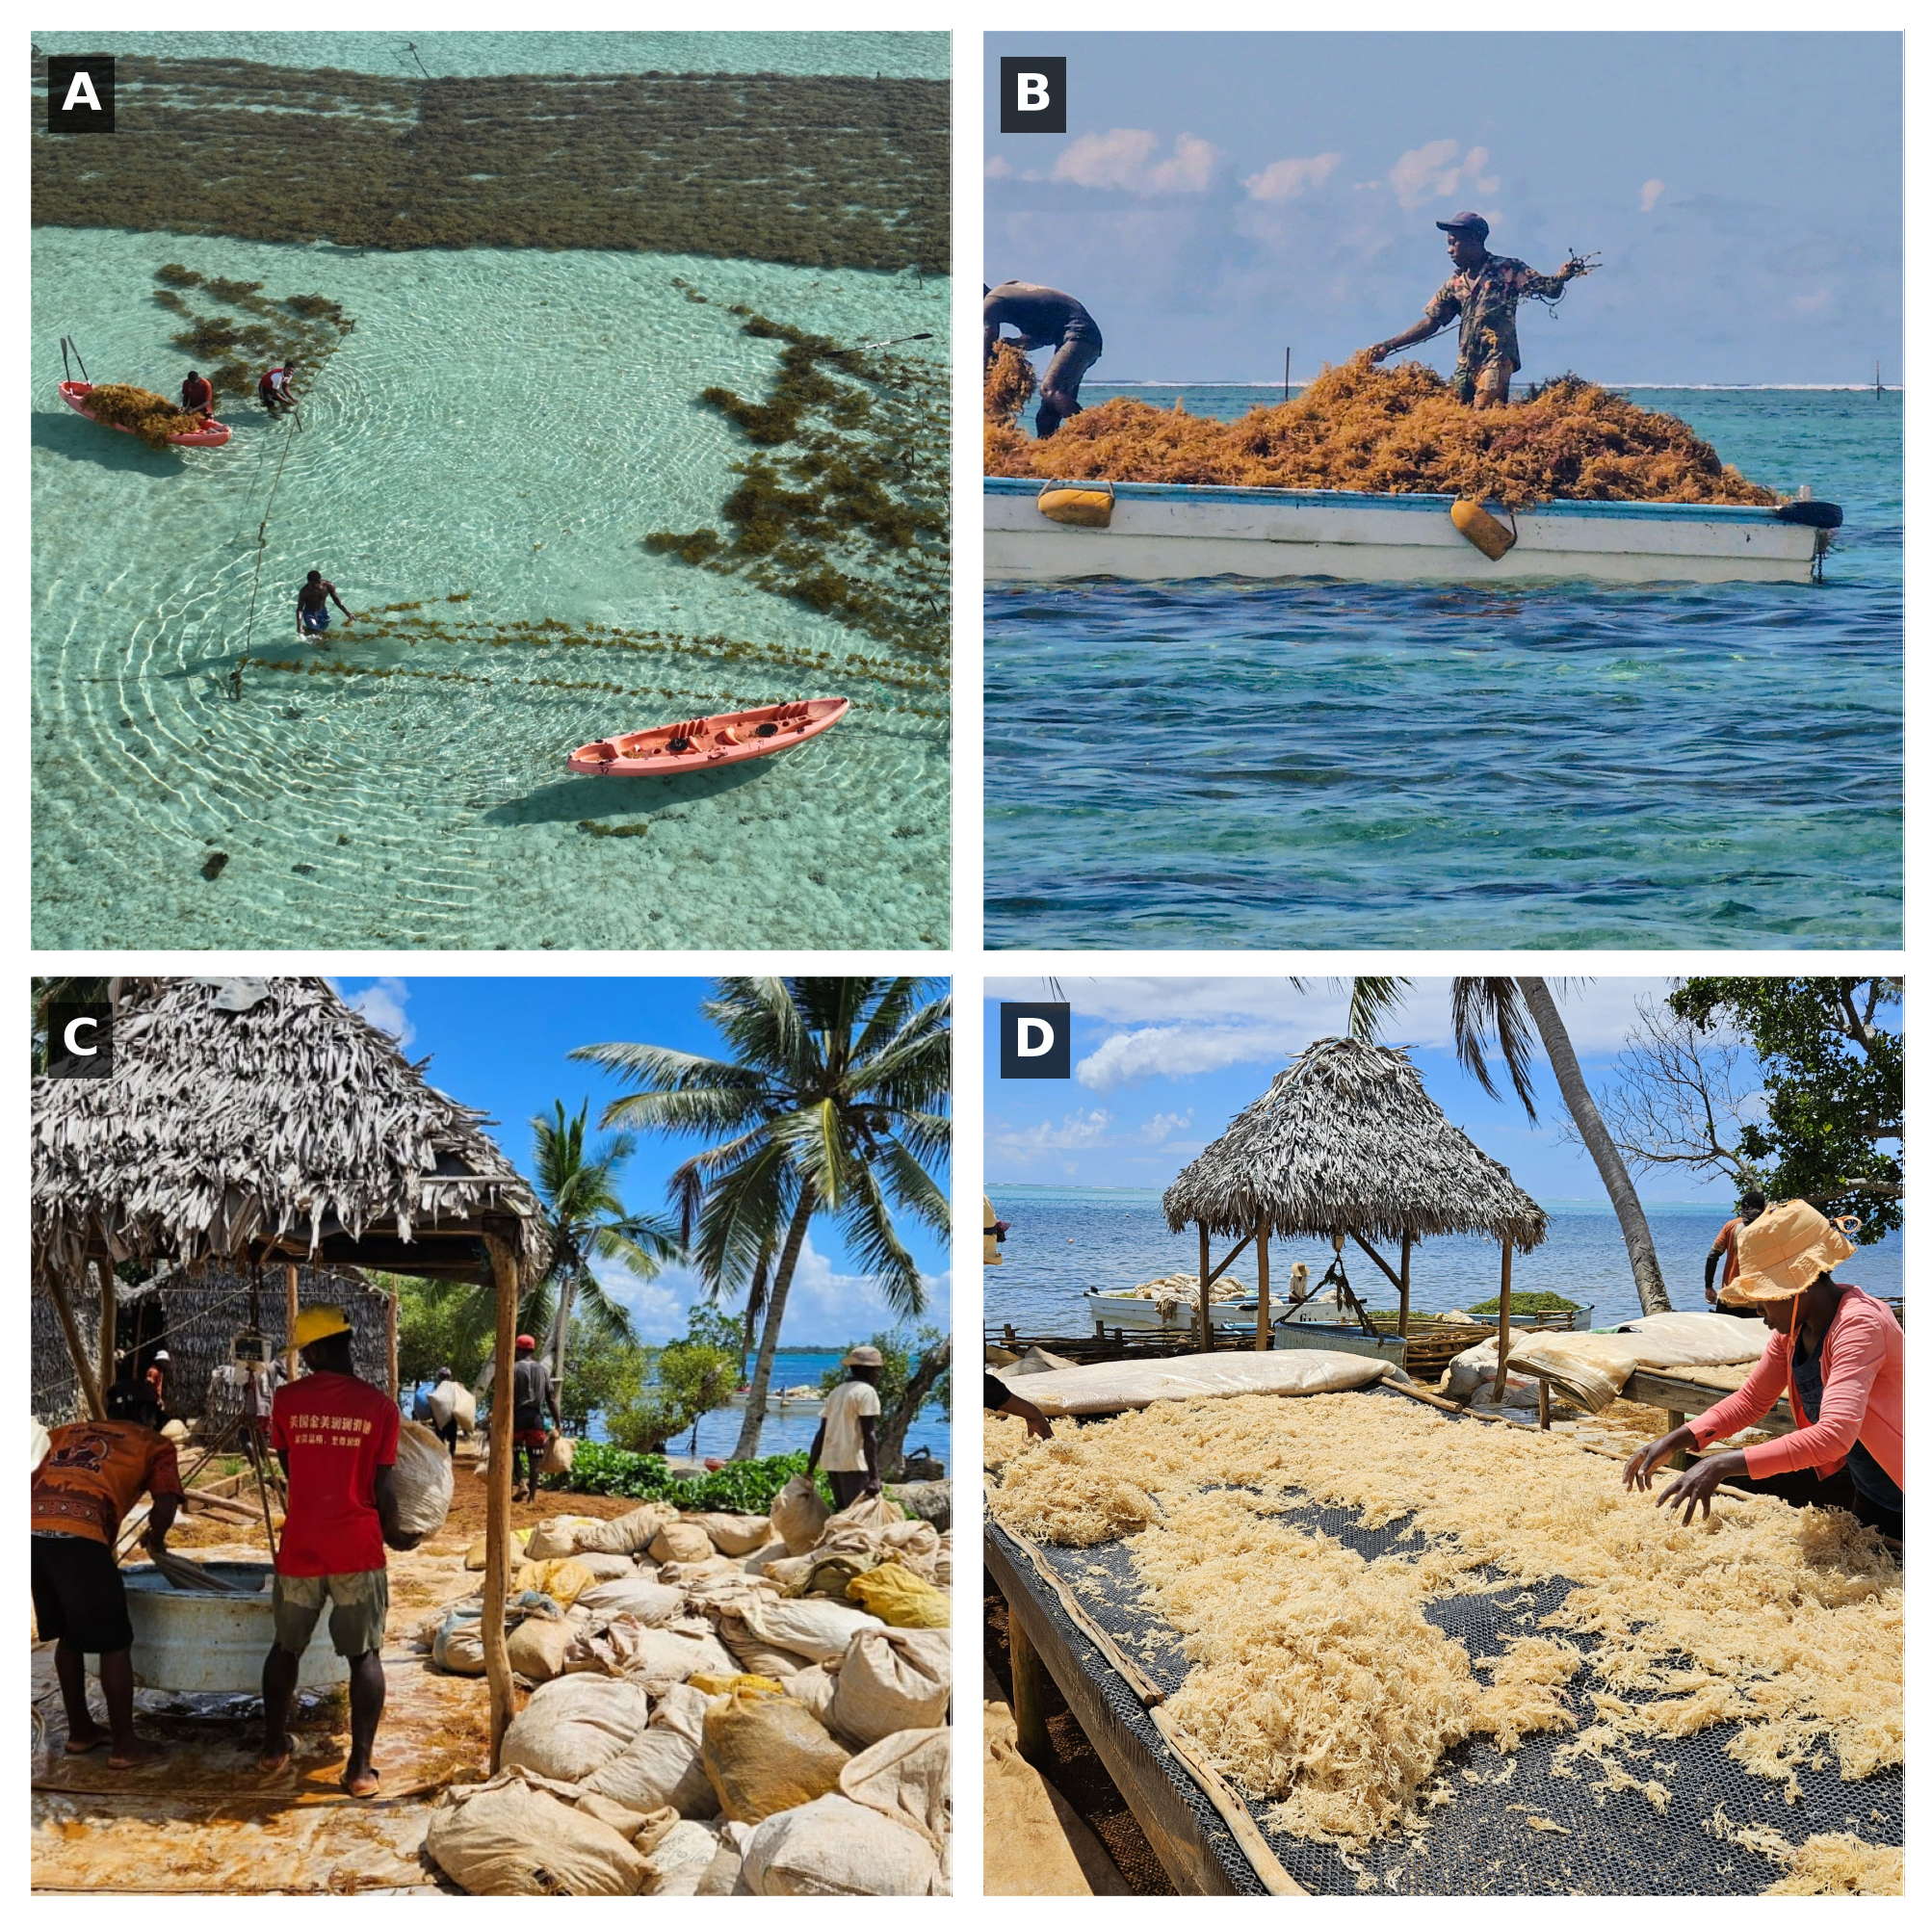
Between the 1st and the 5th of December 2025, A field campaign was conducted to collect in situ data on the harvested biomass of Kappaphycus alvarezii cultures within the study area. The planning of harvesting was established a few days before the harvesting period, allowing to select and identify 126 cultivation plots that will be harvested in the upcoming days. The harvesting process was operated by the farmers of the Nosy Boraha Seaweed Company, following their usual practices. Each plot was harvested by detaching the cultivation lines from the entire cultivation plot (Figure 2 A). The harvested lines were then placed on flat boats to be transported to the shore, where all the lines of a single plot were weighted using a standard scale (Figure 2 B & C). Therefore, a dataset of the fresh weight of harvested biomass per plot was obtained and used as reference data for the calibration and validation of the algorithm.
2.2.2 Drone surveys
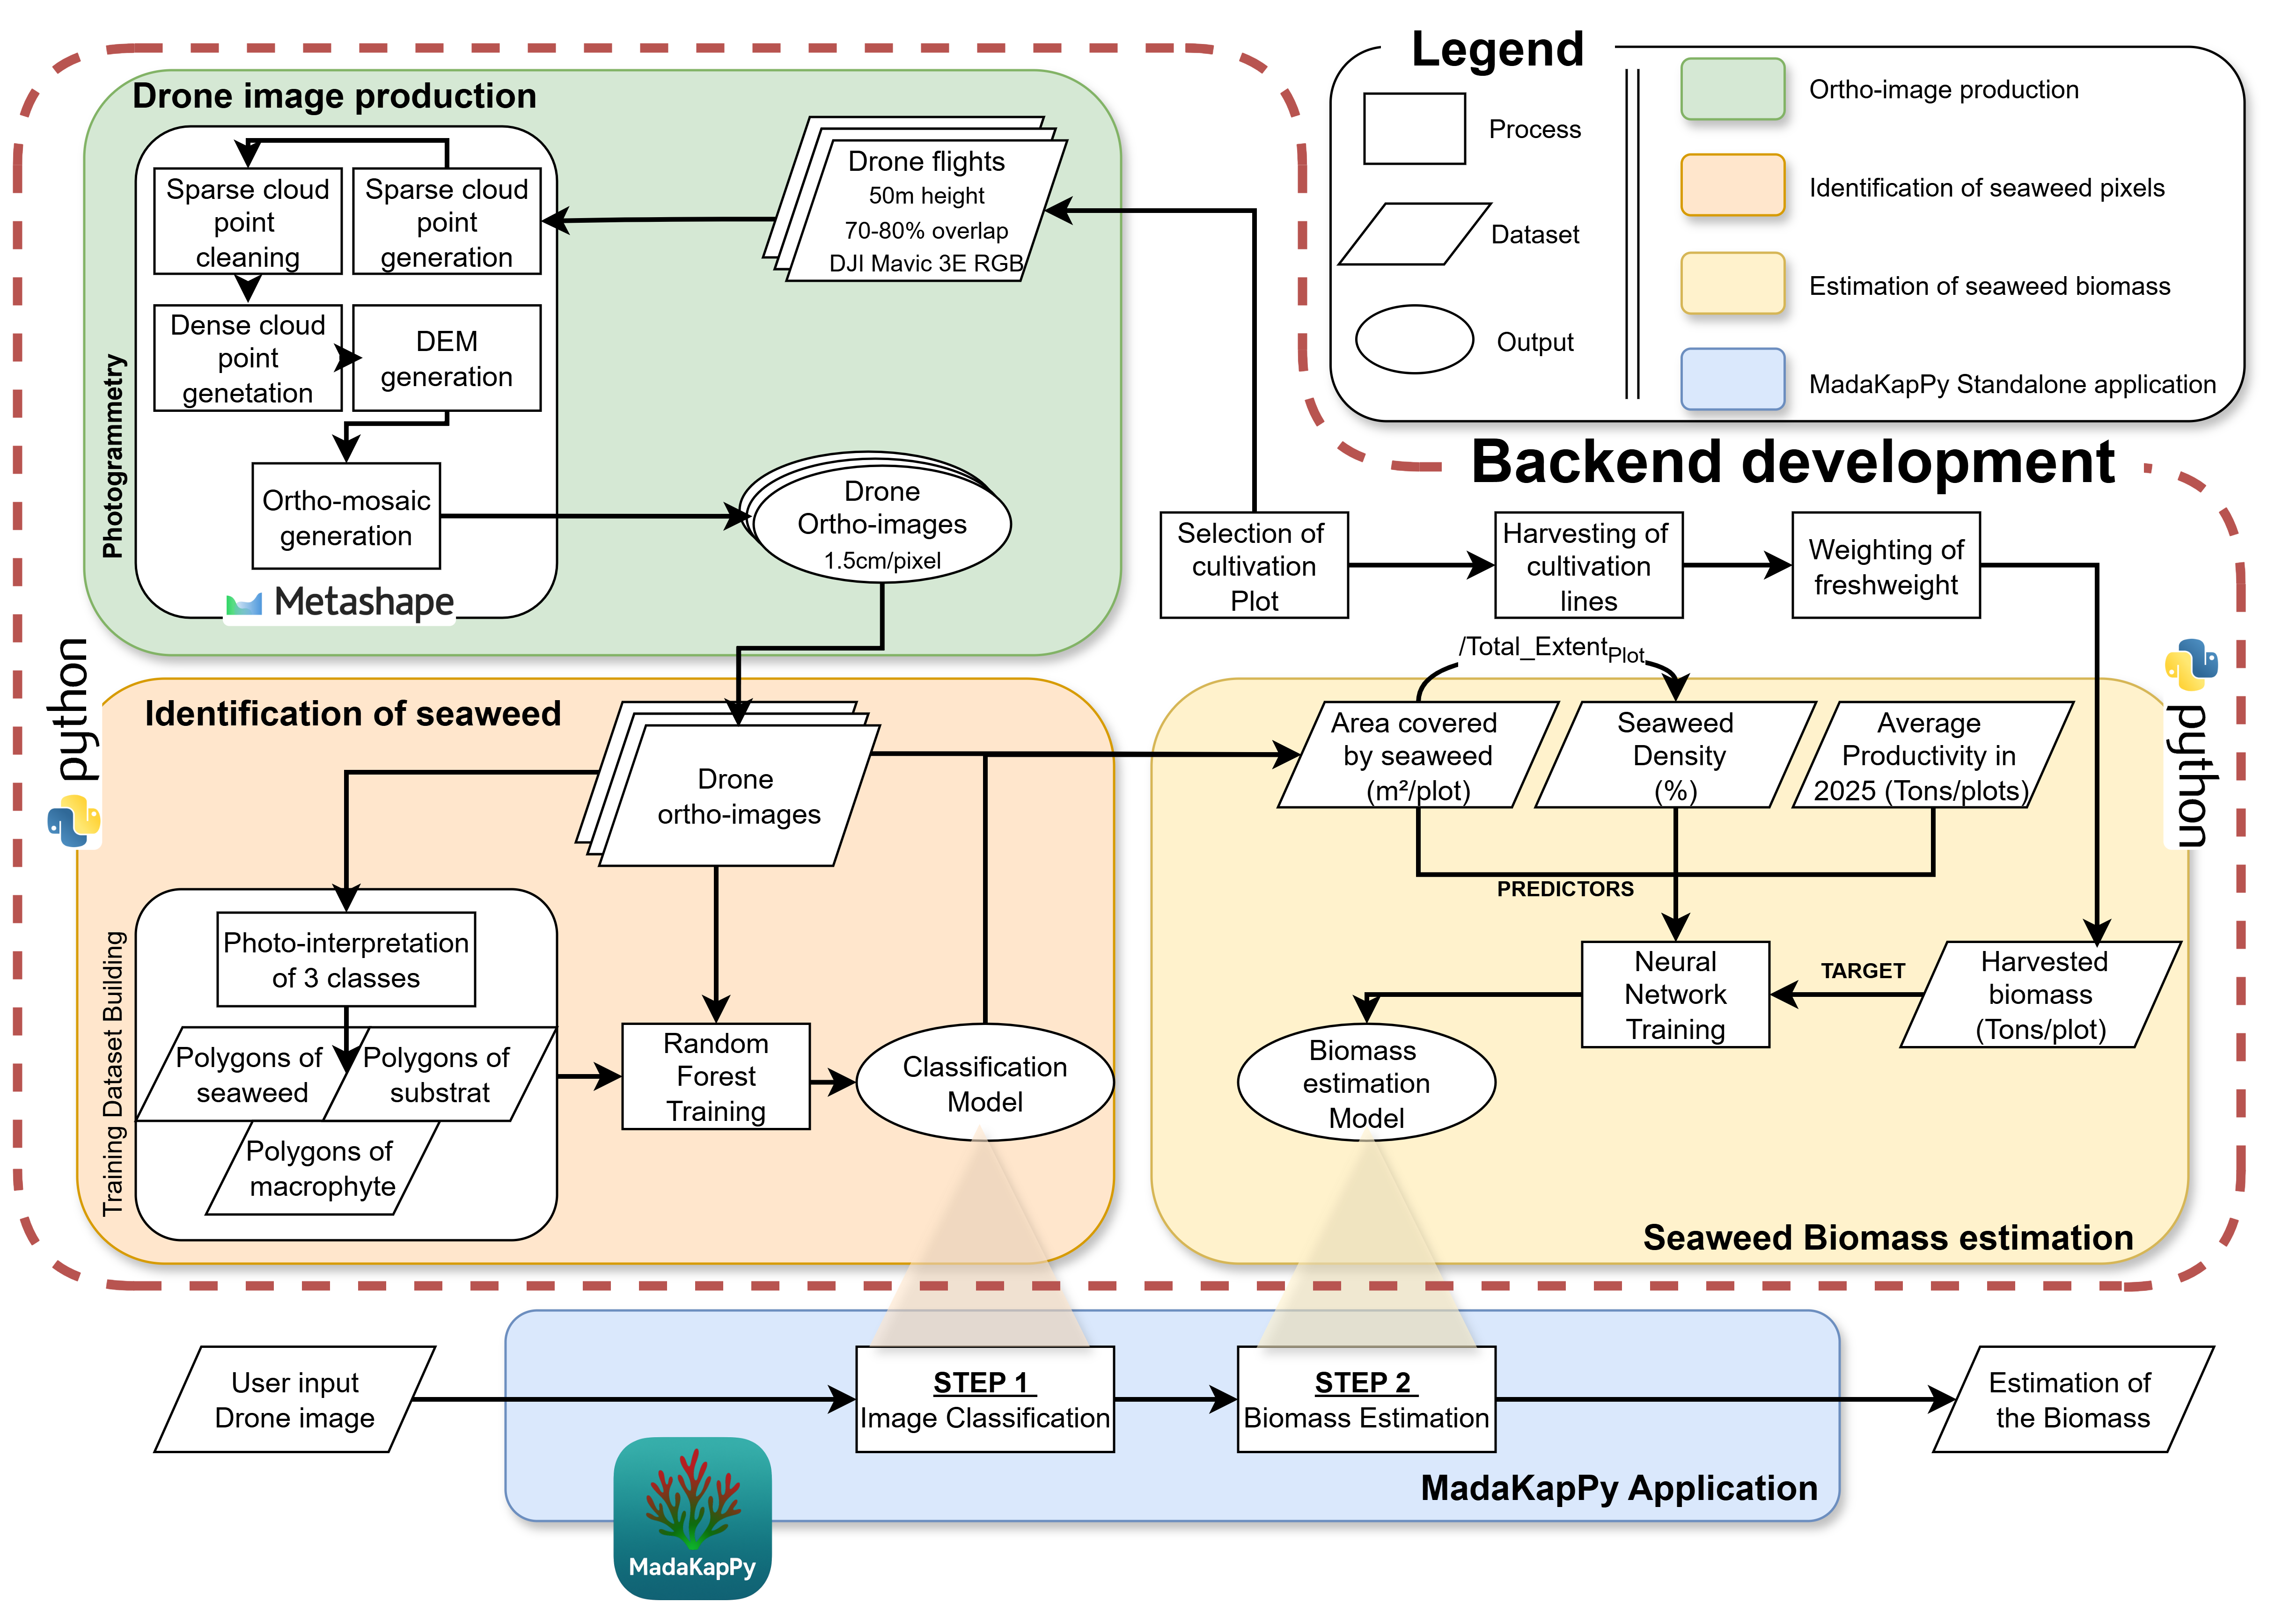
Seaweed harvesting in the lagoon is systematically synchronised with low tide, as reduced water levels facilitate access to the cultivation lines. During the survey period (1–5 December 2025), low tides occurred between 04:25 and 07:54 local time, with sunrise around 05:00; water levels were less than 1m during flights. Unmanned aerial vehicle (UAV) surveys were conducted prior to the onset of daily harvesting activities, targeting cultivation plots scheduled for harvest that day (Figure 3 - Green sector). Early-morning flights were necessary both to coordinate with harvesting operations and to optimise imaging conditions. At this latitude (~ 16°S), solar elevation increases rapidly after sunrise, enhancing sun glint on the water surface and degrading image quality over the cultivation structures. Conducting flights shortly after sunrise, combined with the use of a polarising filter on the UAV camera, minimised sun glint and enabled the acquisition of high-quality imagery of the cultivation lines. Drone surveys were performed using a DJI Mavic 3 Enterprise, equipped with a 4/3 CMOS sensor and a 24 mm equivalent lens. The UAV was flown at an altitude of 50 m above ground level, resulting in a ground sampling distance of around 1.5 cm. Flight plans were designed to cover the entire area of each targeted cultivation plot with 80% of front overlap and 70% side overlap. Imagery from each flight was processed using a structure-from-motion photogrammetry workflow implemented in Agisoft Metashape (v2.1.1) to generate orthomosaics. The same processing pipeline was consistently applied across all datasets. Initially, tie points were automatically identified both within individual images and across overlapping image pairs to construct a sparse point cloud. This preliminary cloud was subsequently filtered based on reprojection error to eliminate low-quality or noisy points. A dense point cloud was then generated using multi-view stereo reconstruction. From this dense representation, a continuous surface was interpolated to produce a digital surface model (DSM), which served as the geometric basis for orthorectification and the generation of the final orthomosaic.
2.2.3 Spatial heterogeneity of the algae production
Because the production of seaweed was not homogeneous across the lagoon, being able to identify cultivation plots that are more productive than others can help to better predict the production of each individual plot. The production of each individual plot of the year 2025 was retrieved from the Nosy Boraha seaweed company. The dataset records the total freshweight harvested per plot along the year. Each cultivation plot is associated with a unique identifier, which allowed production records to be matched to their corresponding spatial location using the seaweed-farming cadaster.
2.3 Random Forest classification
Seaweed cultivation lines were identified from drone imagery using a Random Forest classifier. This ensemble learning method, originally introduced by Breiman (2001) combines multiple decision trees built through bootstrap aggregation (bagging) to improve predictive performance and robustness. Random Forest has been widely applied in ecological remote sensing, including ecosystem mapping and aquaculture monitoring (Nurdin et al., 2023; Oiry and Barillé, 2021; Román et al., 2026). The approach relies on supervised classification, where the model is trained using labeled samples to learn relationships between predictor variables and target classes. At each iteration, a decision tree is constructed from a bootstrap sample of the training dataset, while a random subset of predictor variables is considered at each split. This dual randomisation reduces overfitting and allows the model to effectively handle non-linear relationships and collinearity among predictors. Final pixel-wise classification is obtained through majority voting across all trees, whereby each tree contributes a class prediction and the most frequent class is assigned to the pixel.
For model construction, training data were derived at the pixel level from polygons manually assigned to the target classes and overlaid on the drone orthomosaic (Figure 3 - Orange sector). All valid pixels intersecting each polygon were extracted as individual training samples. Band values were scaled to a common 0-1 range according to image bit depth before model fitting to reduce the effect of brightness changes between flights. Class labels were taken directly from the polygon attribute table. To limit the effect of class imbalance, the number of pixels per class was limited by down-sampling all classes to the size of the least represented class; when applied, sampling was performed without replacement using a fixed random seed. Model tuning was conducted by randomised search over 20 hyperparameter combinations, including the number of trees (200-600), maximum tree depth (10, 20, 30, or unrestricted), minimum number of samples per terminal node (1, 2, or 4). Candidate models were evaluated using stratified cross-validation with up to five folds, with the exact number of folds constrained by the size of the least represented class, and balanced accuracy was used as the optimisation criterion. The final classifier corresponded to the hyperparameter set that produced the highest cross-validated balanced accuracy, and internal model performance was summarised using a cross-validated confusion matrix. The retained Random Forest model comprised 500 trees, a maximum tree depth of 20,and a minimum of four samples per terminal node.
This classification represents the first step of the MadaKapPy workflow, enabling the identification of seaweed pixels used to estimate the area covered within each cultivation plot (Figure 3 - Blue sector).
2.3.1 Model building
The training dataset was generated through manual photo-interpretation of drone imagery by three independent operators. Homogeneous areas were delineated and assigned to one of three classes: (i) seaweed cultivation (including both green and brown kappaphycus morphotypes), (ii) bottom substrate (comprising bare sediment and coral reef), and (iii) bottom vegetation (macrophytes naturally occurring within the lagoon). This multi-operator approach was adopted to improve the robustness and consistency of the training dataset while reducing potential bias associated with individual operators.
2.3.2 Model validation
???
2.4 Neural Network, From area to Biomass
Estimating in situ seaweed biomass from drone imagery cannot rely on a simple univariate relationship. First, the relationship between surface area and biomass is inherently non-linear, as biomass scales with volume rather than area. Second, for a given surface coverage, variations in vertical growth (i.e., canopy thickness) can lead to substantial differences in biomass while remaining indistinguishable in nadir imagery. Third, biomass production may vary independently of areal extent due to factors nutrient availability or hydrodynamic.
To account for these sources of variability, a multivariate modeling approach was adopted based on a neural network framework (Figure 3 - Yellow sector). Biomass was estimated as a function of several complementary predictors:
\[Estimated_{Biomass} = f(Area_{Seaweed}, Density_{Plot}, Average_{Production} )\]
\(Estimated_{Biomass}\) was predicted using a plot-level feed-forward neural network trained from harvest records and drone-derived descriptors. The training dataset was assembled by matching observed harvest biomass to cultivation plots using farm and module identifiers. For each plot, the area occupied by Kappaphycus classes (\(Area_{Seaweed}\)) was calculated from the classified imagery. Percent cover (\(Density_{Plot}\)) was then derived as the proportion of the cultivation plot area occupied by these classes. To represent plot-specific production history, daily growth was calculated from harvested weight after normalisation by culture duration and number of cultivation lines; these values were then summarised for each plot by their average (\(Average_{Production}\)).
Observed biomass was log-transformed before model fitting to reduce skewness and stabilise variance, and all predictors were standardized using the mean and standard deviation of the training set. The network consisted of an input layer followed by two fully connected hidden layers with 32 and 16 units, respectively, using rectified linear unit activation functions, with a dropout layer (rate = 0.2) inserted between the hidden layers. Model training used the Adam optimiser (learning rate = 0.001) and mean squared error loss for 3000 epochs with a batch size of 16 and no shuffling of the training data. Predictions were subsequently back-transformed by exponentiation to return biomass estimates on the original scale.
2.5 MadaKapPy standalone application
The full workflow was implemented in a standalone desktop application developed in Python to enable routine use without command-line interaction (Figure 3 - Blue sector). The application provides a graphical user interface built with Flet and was packaged as a self-contained Windows executable together with the required Python dependencies, geospatial libraries, trained classification and biomass models, scaler files, and auxiliary lookup tables. Within the interface, users specify the input orthomosaic, area-of-interest shapefile, model directory, and output location, after which Random Forest classification and biomass estimation are executed sequentially through a single workflow. To support operational use, the application includes automated management of resource paths, progress reporting during computation, preview maps for visual inspection of classification outputs, and run-history logging to retain model settings and output file locations. This implementation was intended to make the processing chain reproducible and accessible to end users while preserving the underlying analytical workflow described above.
3 Results
3.1 Spatio-temporal variability of seaweed production
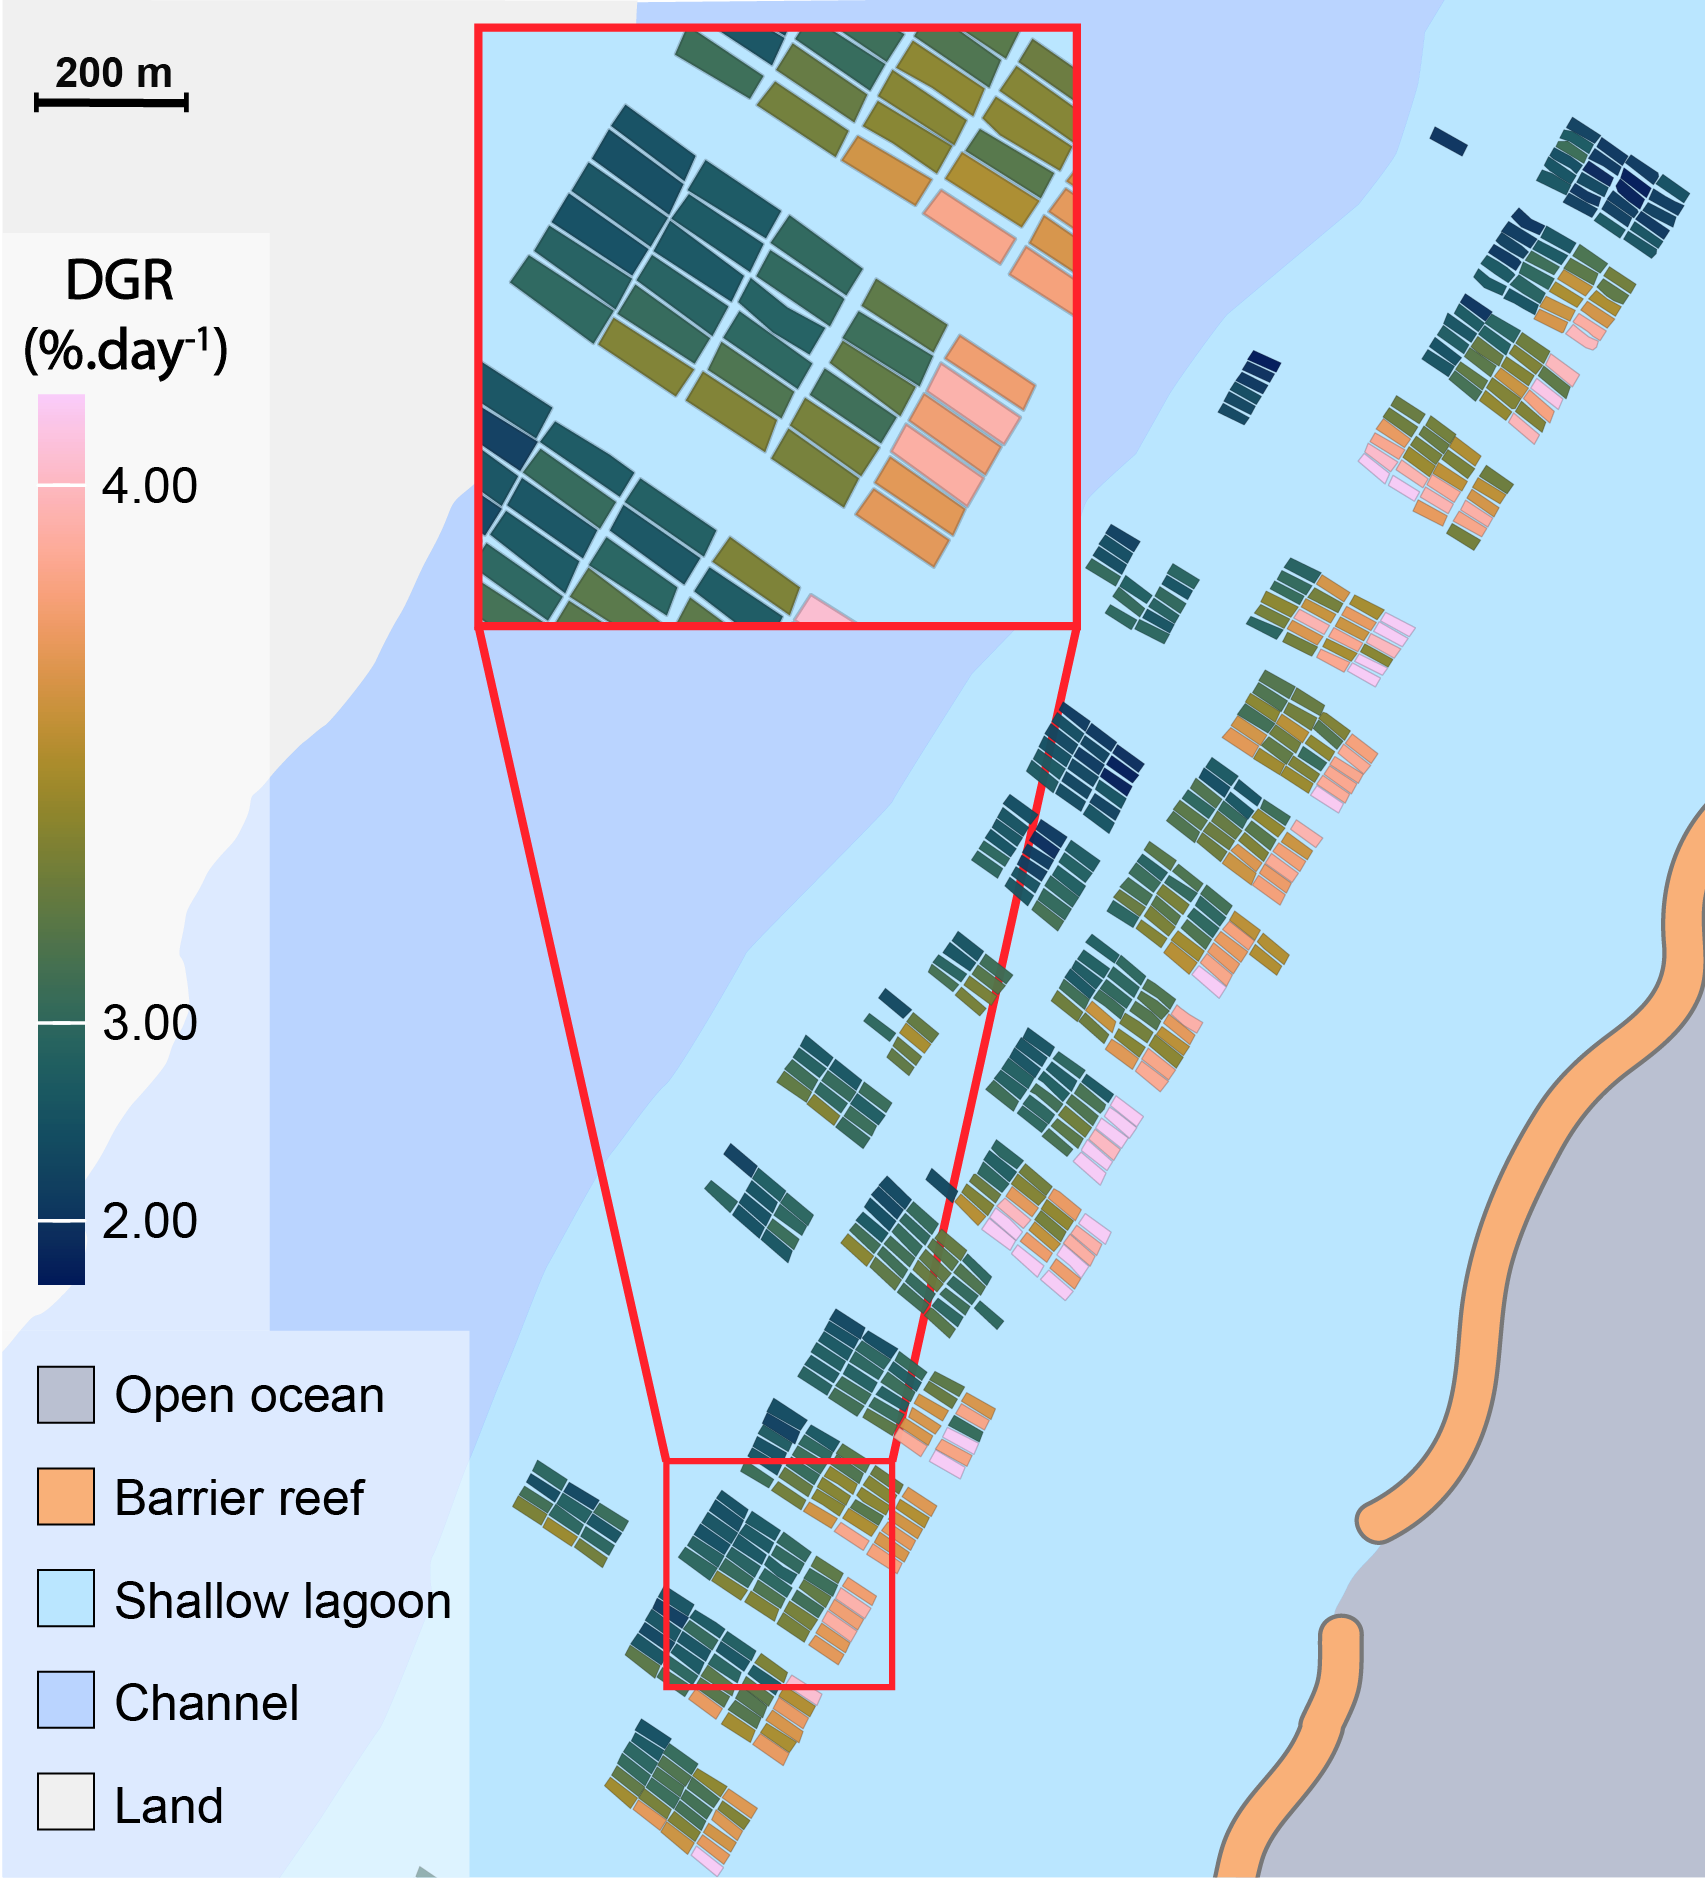
Across the lagoon, the daily growth rate (DGR) of cultivation plots displayed a marked spatial structure (Figure 4). Higher mean DGR values were generally observed in plots located along the eastern side of the lagoon, closer to the coral barrier, where several plots reached ca. 4 %.day⁻¹. In contrast, plots positioned toward the central channel and the inner lagoon showed consistently lower DGR values, in some cases close to 2 %.day⁻¹. This pattern was consistent across the entire lagoon, suggesting that DGR may be influenced by a dominant environmental gradient across the lagoon. Within several modules, DGR also varied among adjacent plots, indicating substantial fine-scale heterogeneity. The main exception to the overall spatial gradient was the northernmost cultivation module, where low DGR values were observed across most plots, irrespective of their relative position within the module.
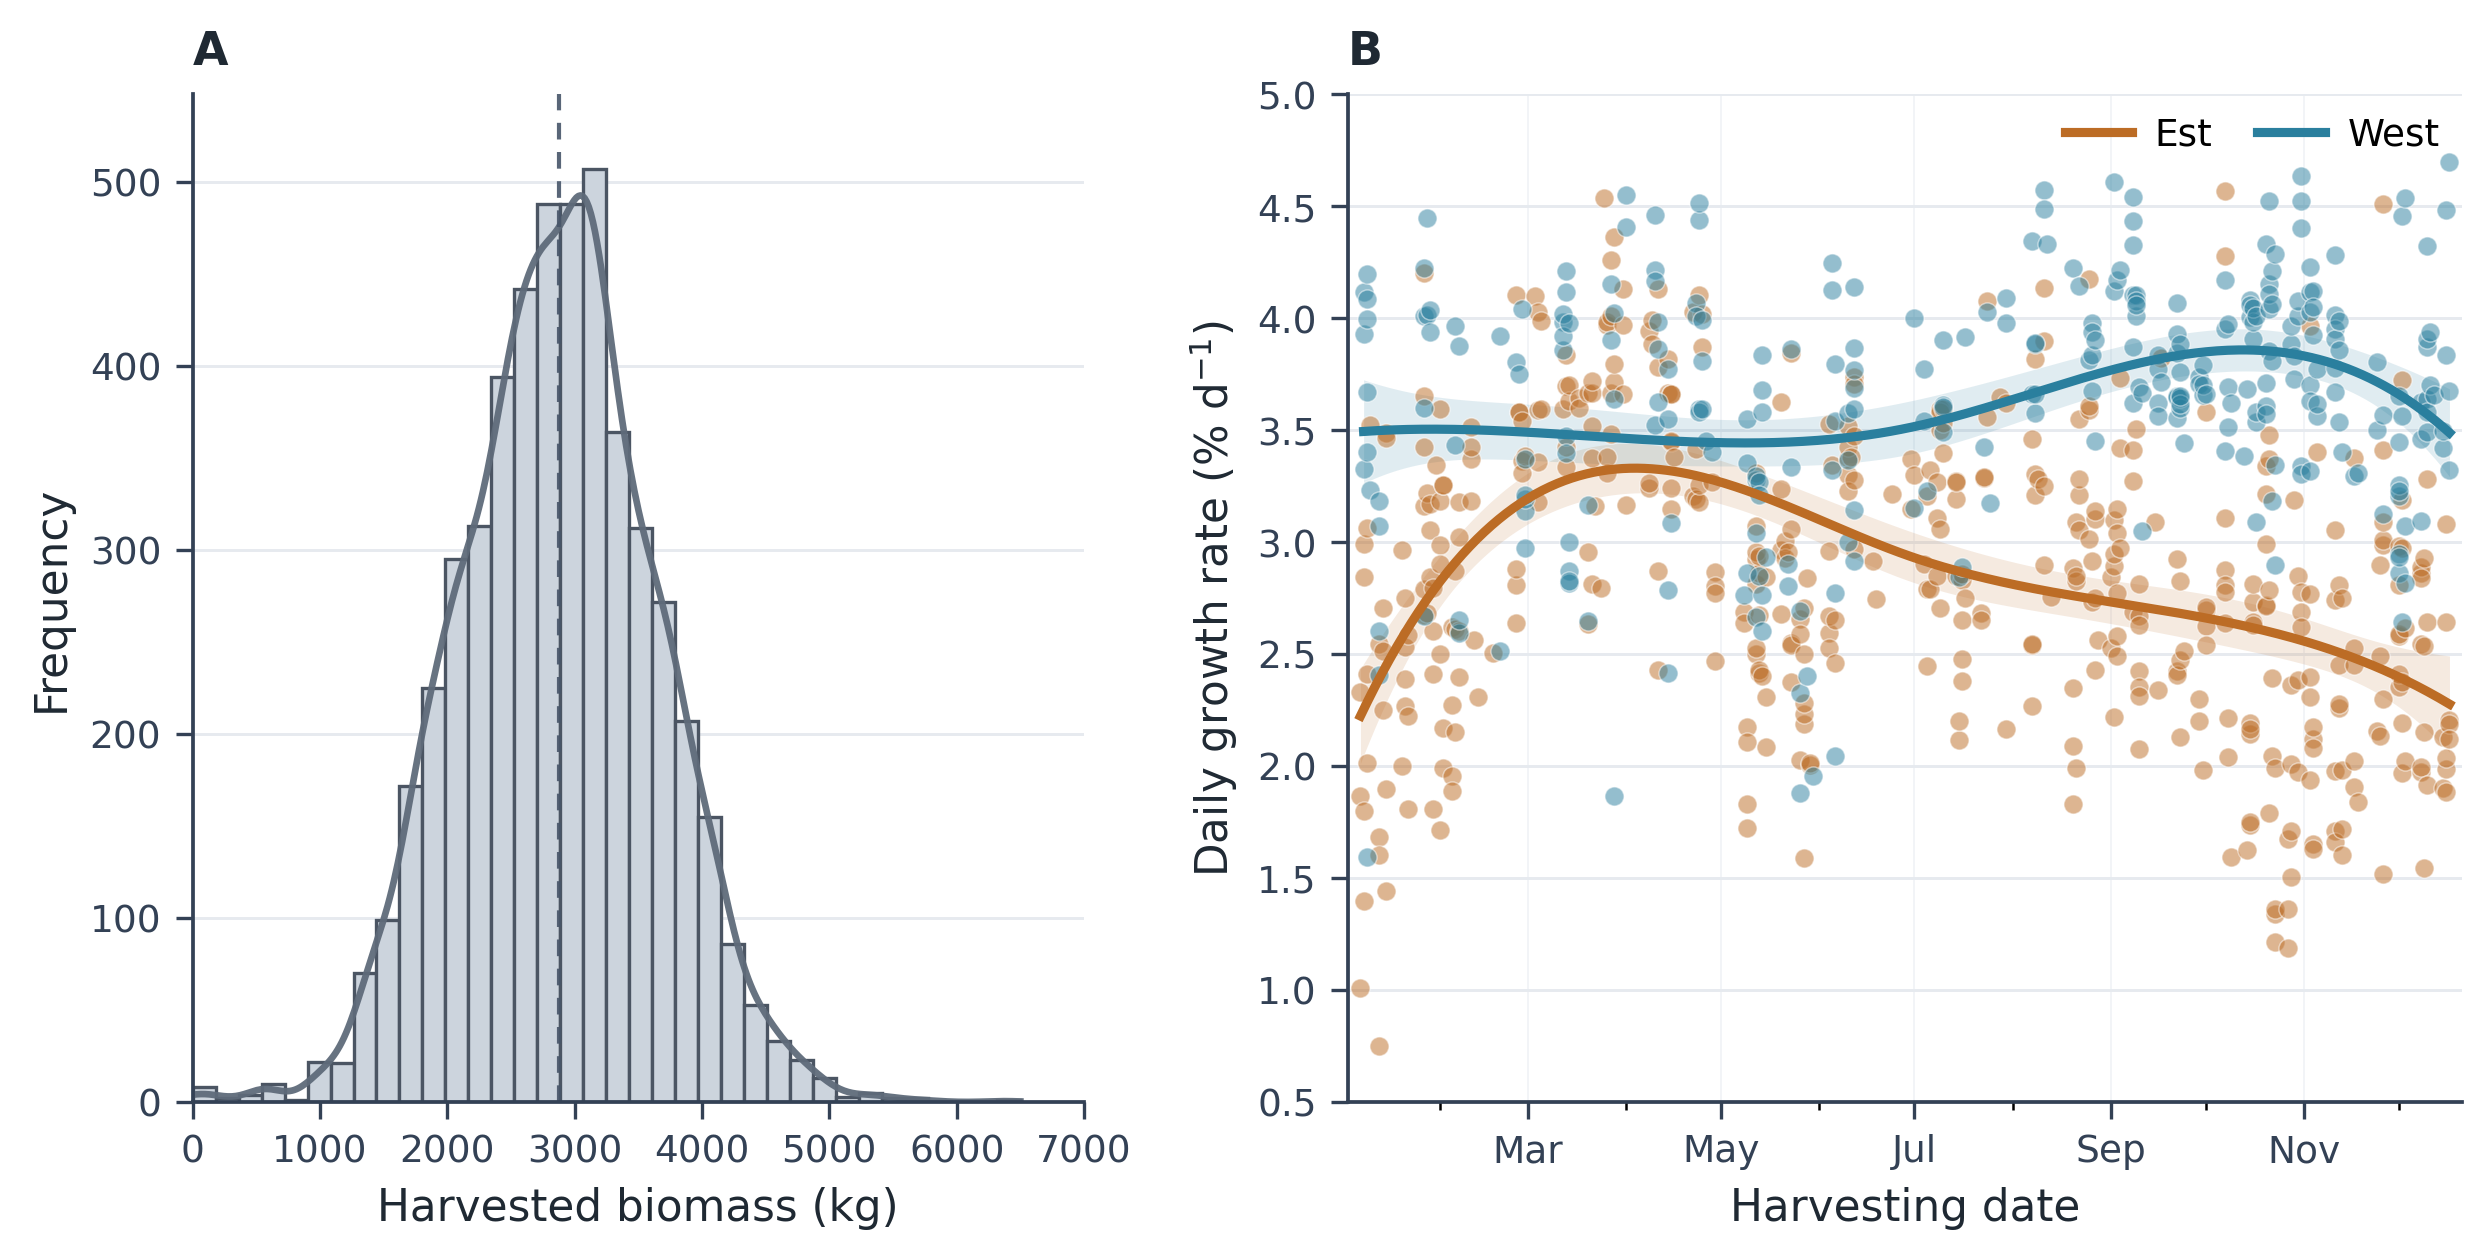
Cultivation plots were harvested at an average biomass of ca. 2900 kg (Figure 5 A). Depending on plot-specific daily growth rates (DGR), this target biomass was generally reached after 4 to 6 weeks of cultivation. However, there was a large variability of harvested biomass ranging form 1000 to 5000 kg per cultivation plot.
Temporal patterns in DGR differed according to the position of cultivation plots within the lagoon (Figure 5 B). Plots located closest to the reef barrier showed relatively stable DGR throughout the year, with an average of 3.57 %.day⁻¹ in 2025. In these plots, DGR was higher in October, reaching 3.88 %.day⁻¹. In contrast, plots located closest to the channel displayed a stronger seasonal variability. Their maximum DGR was observed in April, when values were comparable to those recorded near the coral reef barrier. However, between June and February, DGR in channel-adjacent plots was significantly lower than in reef-adjacent plots, reaching values as low as 2.25 %.day⁻¹ in December and January.
3.2 Random Forest Classification
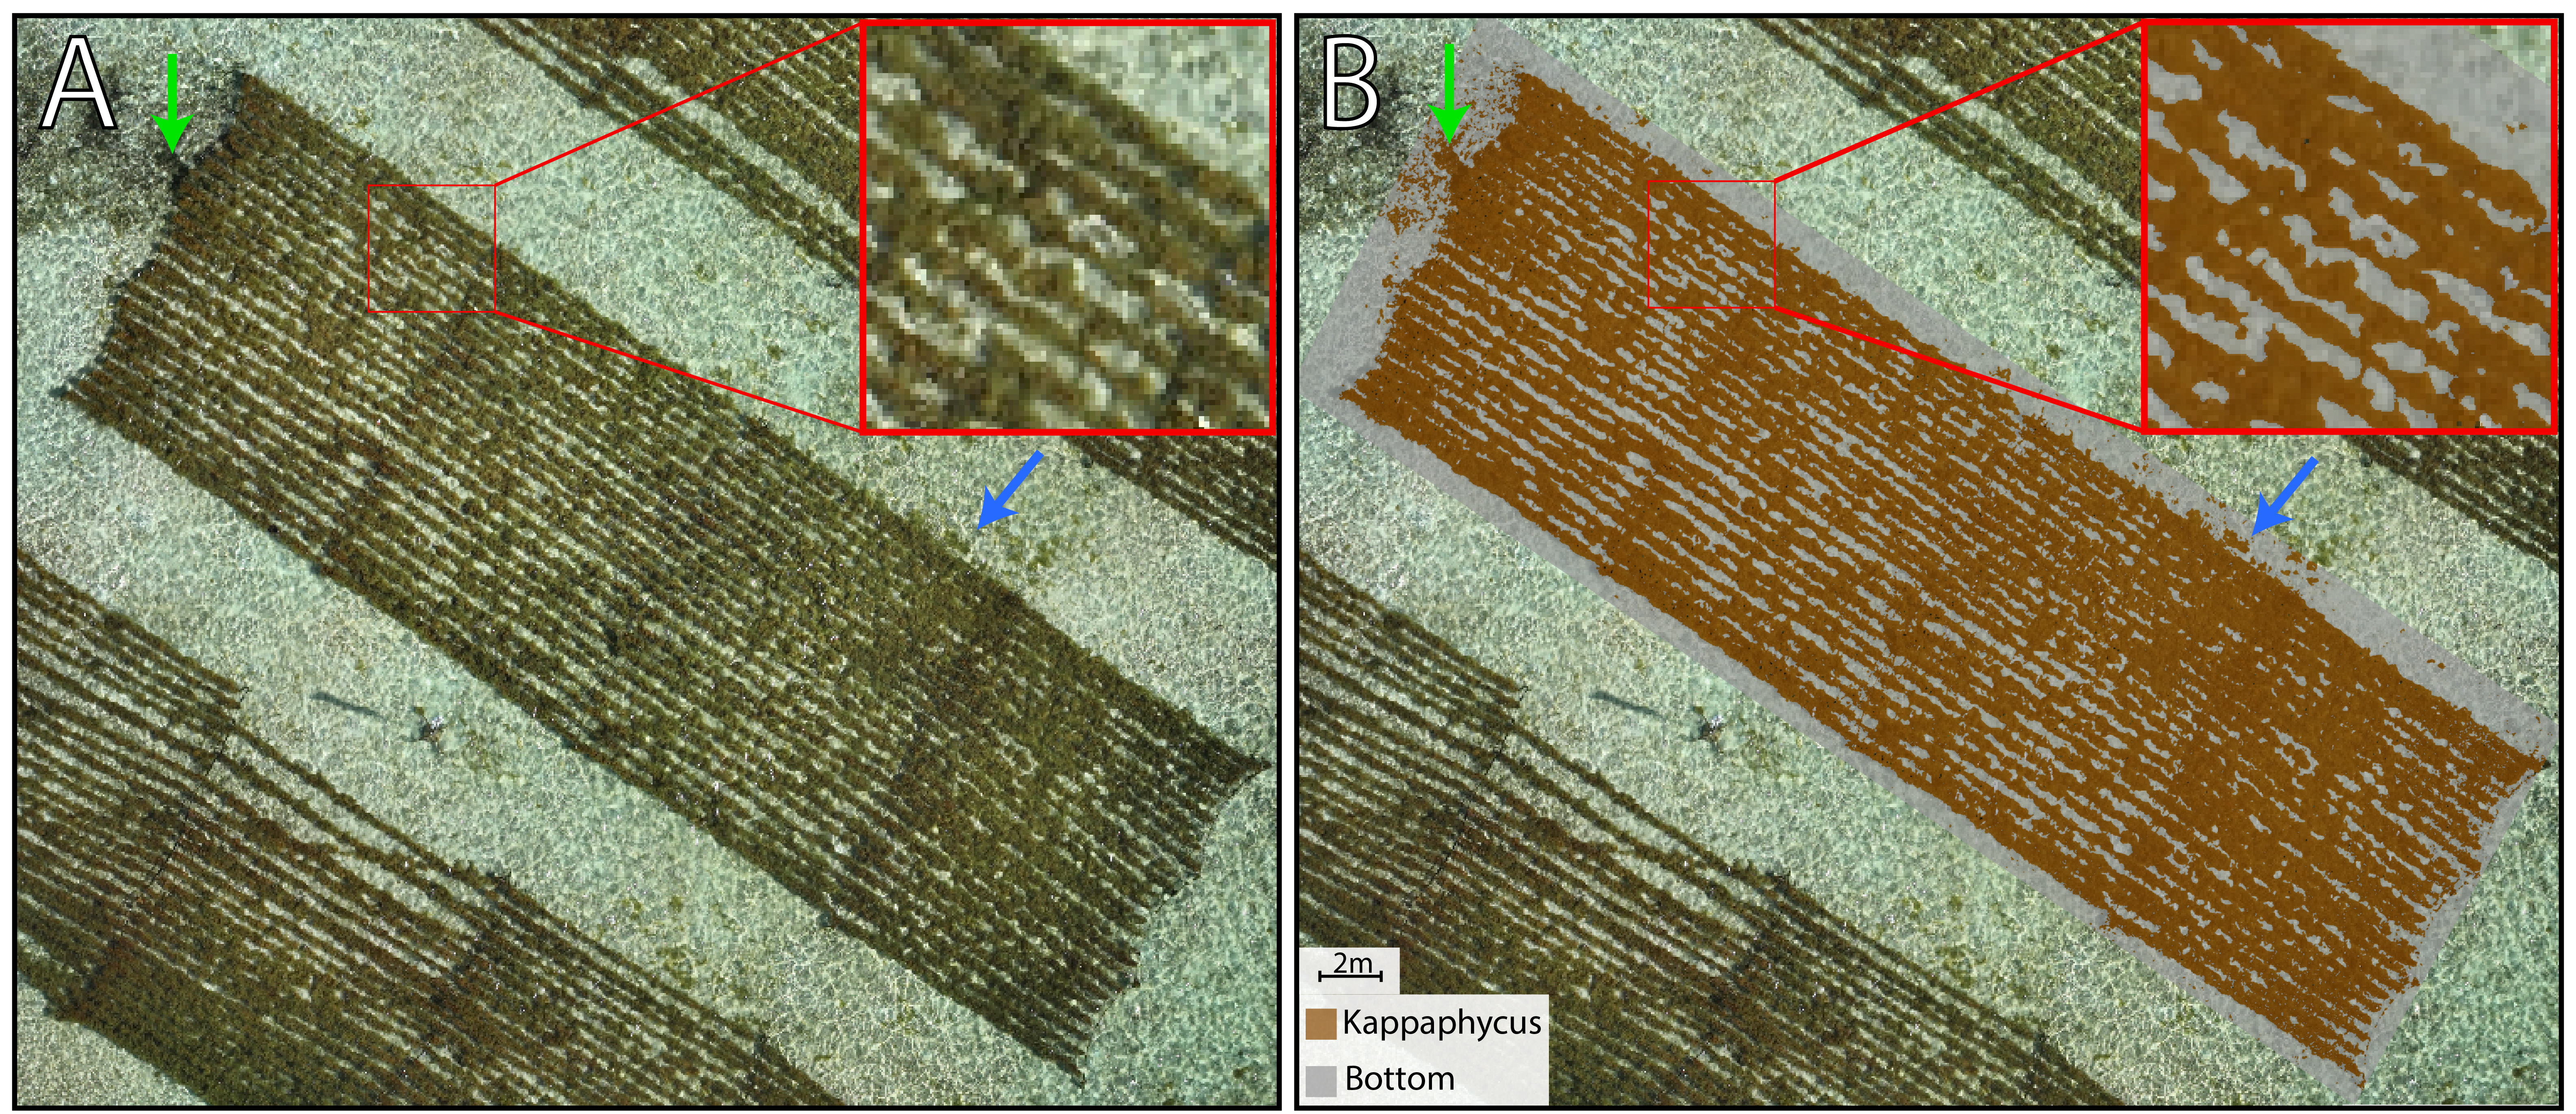
The first step of the MadaKapPy workflow consists of identifying Kappaphycus cultivation lines from the drone imagery provided by the user. This step is based on a Random Forest classifier trained to discriminate Kappaphycus from other image targets using RGB information. Figure 6 illustrates the classification output for a single cultivation plot. The RGB orthomosaic shows that the cultivated seaweed is organized along regularly spaced lines, although individual thalli and line structures are locally heterogeneous in density and optical appearance (@fig-rf-classification-map A). The classification output reproduced this spatial organization, with most cultivation lines correctly assigned to the Kappaphycus class (Figure 6 B). The inset further shows that the classifier was able to detect fine-scale discontinuities within the cultivation lines, corresponding to gaps or lower-density areas visible in the RGB image.
Overall, the Random Forest classification provided a coherent delineation of cultivated Kappaphycus biomass at the plot scale. However, some specific cases highlight the distinction between detecting Kappaphycus pixels and identifying harvestable biomass. During the cultivation cycle, cultivation ropes may break (Figure 6, green arrow), and fragments of Kappaphycus thalli may detach from the ropes and accumulate on the seafloor (Figure 6, blue arrow). In these situations, the classifier can still correctly assign these pixels to the Kappaphycus class, because their spectral and visual characteristics remain similar to attached cultivated thalli. However, detached or stranded material is unlikely to be recovered during harvest. Therefore, although these classifications are not necessarily errors from an image-classification perspective, they may introduce uncertainty when classified Kappaphycus area is subsequently used as a proxy for harvestable biomass.
?? VALIDATION ??
3.3 Biomass estimation
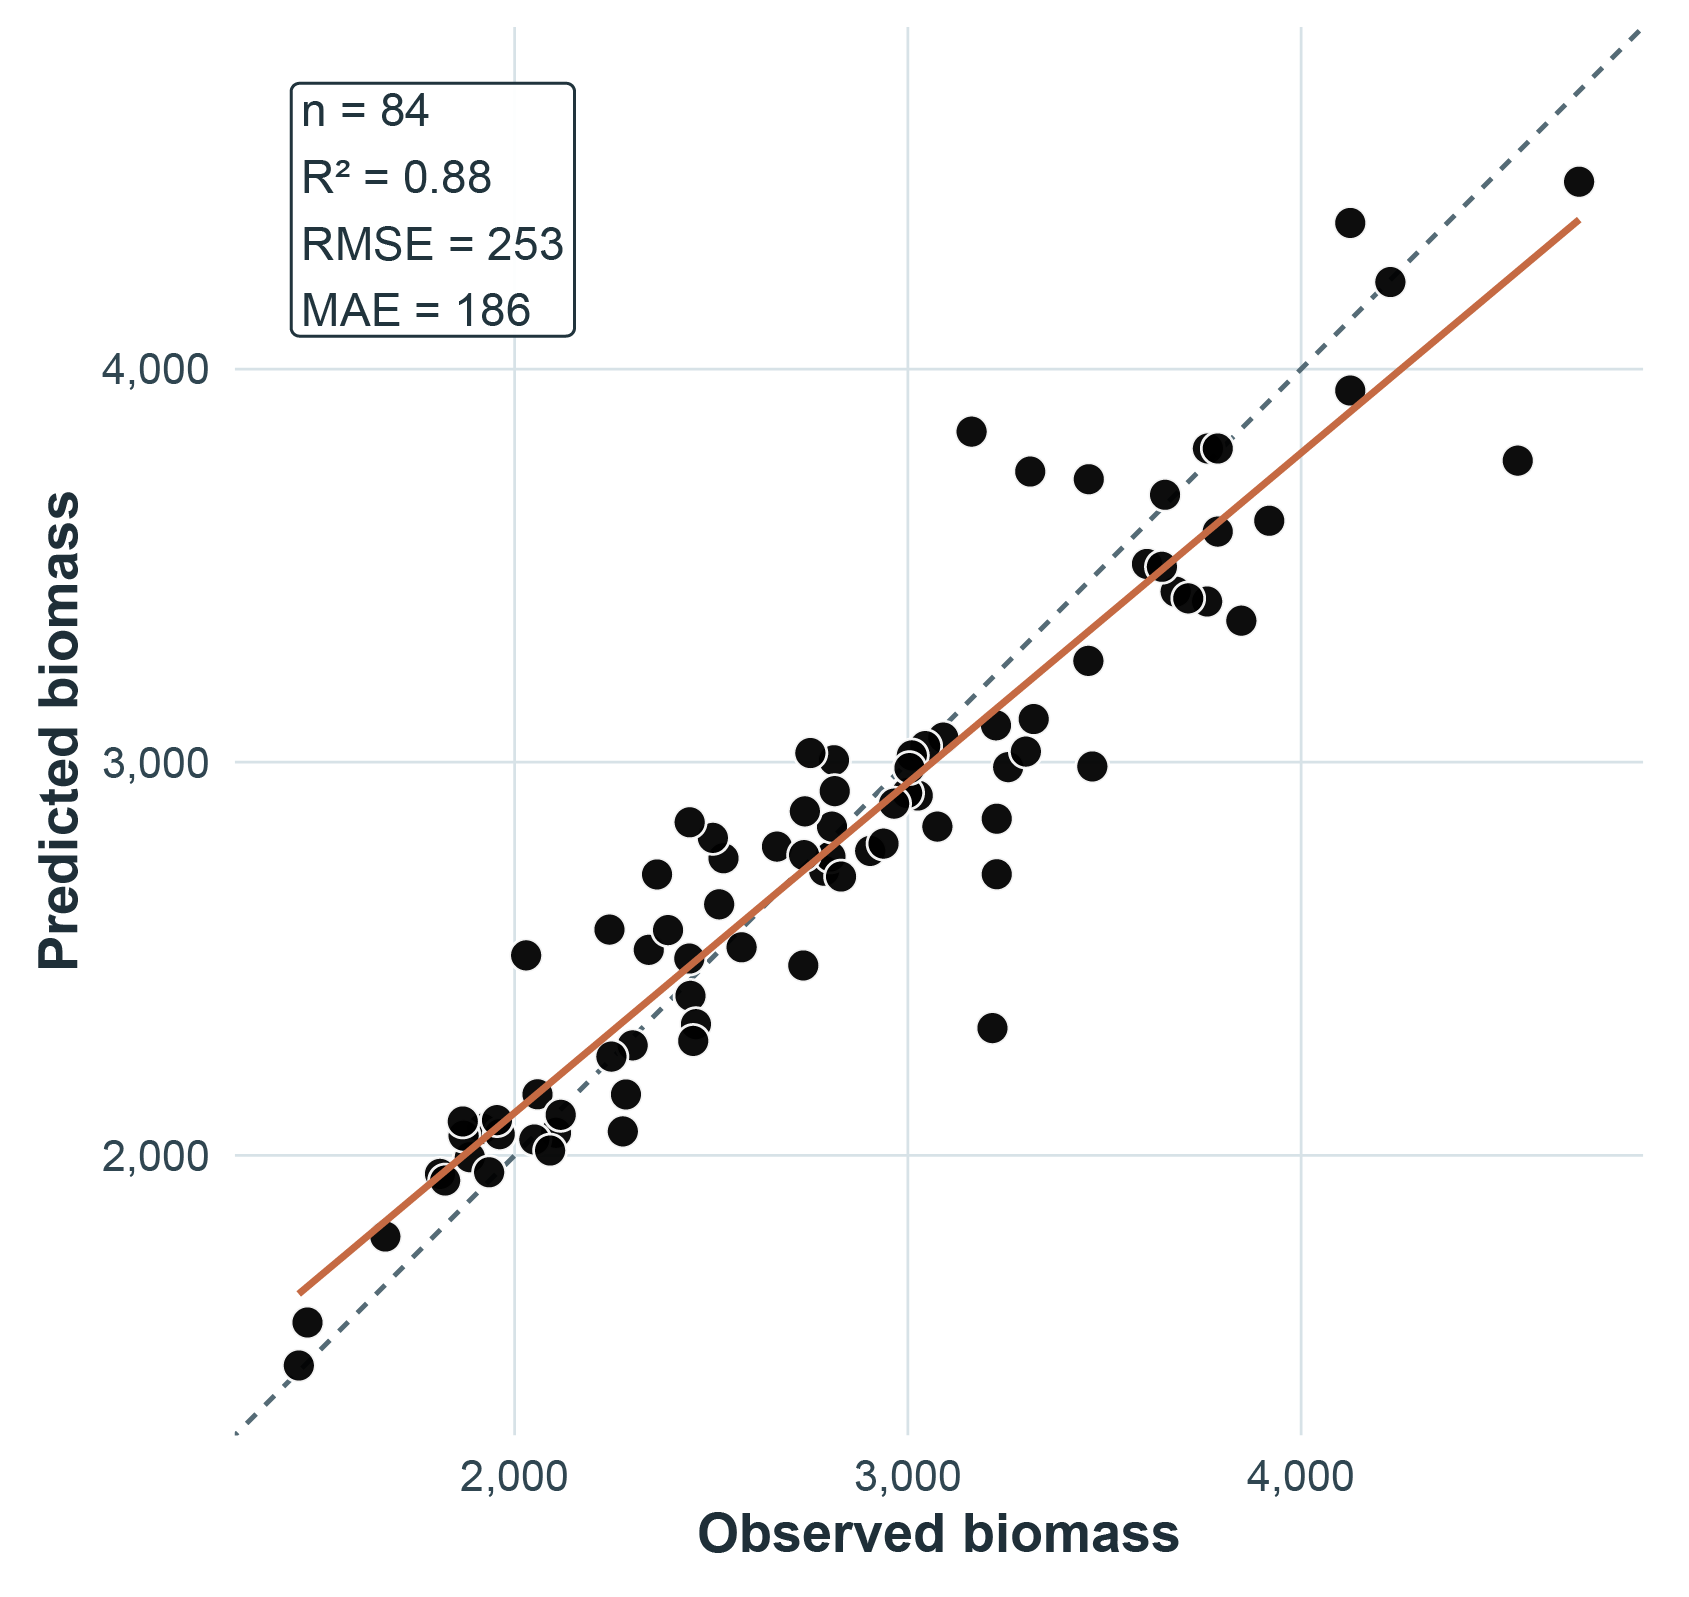
The biomass model showed a strong agreement between observed and predicted harvested biomass (n = 84; Figure 7). Predicted biomass values were closely distributed around the 1:1 line, indicating that the model captured most of the variability in harvested biomass among cultivation plots. Model performance was high, with an R² of 0.88, an RMSE of 253 kg, and an MAE of 186 kg. Most predictions were concentrated between 2000 and 4000 kg, corresponding to the main range of observed harvested biomass.
Despite the overall good agreement, some deviations from the 1:1 relationship were observed. The fitted regression line showed a slight tendency to overestimate biomass at the lower end of the observed range and to underestimate biomass for the highest observed values. This pattern suggests that model uncertainty increased for plots in edge cases of harvested biomass, which may be related to the lower number of training samples in these ranges or to specific characteristics of these plots that were not fully captured by the model features.
3.4 The MadaKapPy application
4 Bibliography
Breiman, L., 2001. Random forests. Machine Learning 45, 5–32.
FAO, 2024. The state of world fisheries and aquaculture 2024: Blue transformation in action. Food; Agriculture Organization of the United Nations, Rome. https://doi.org/10.4060/cd0683en
Hayashi, L., Reis, R.P., Santos, A.A. dos, Castelar, B., Robledo, D., Vega, G.B. de, Msuya, F.E., Eswaran, K., Yasir, S.Md., Ali, M.K.M., Hurtado, A.Q., 2017. The cultivation of kappaphycus and eucheuma in tropical and sub-tropical waters, in: Hurtado, A.Q., Critchley, A.T., Neish, I.C. (Eds.), Tropical Seaweed Farming: Trends, Problems and Opportunities, Developments in Applied Phycology. Springer International Publishing, Cham, Switzerland, pp. 55–90. https://doi.org/10.1007/978-3-319-63498-2_4
Hurtado, A.Q., Critchley, A.T., Neish, I.C. (Eds.), 2017. Tropical seaweed farming: Trends, problems and opportunities: Focus on kappaphycus and eucheuma of commerce, Developments in applied phycology. Springer International Publishing, Cham, Switzerland. https://doi.org/10.1007/978-3-319-63498-2
Innocentini, M.M., Rodrigues, E.F., Mathion, J.K., Caritá, E.C., Simão, L., Marins, M., 2024. Analysis of multispectral indices as a tool for segmenting and quantifying the seaweed kappaphycus alvarezii in a commercial cultivation system. Biomass 4, 933–946. https://doi.org/10.3390/biomass4030052
Joyce, K.E., Fickas, K.C., Kalamandeen, M., 2023. The unique value proposition for using drones to map coastal ecosystems. Cambridge Prisms: Coastal Futures 1, e6. https://doi.org/10.1017/cft.2022.7
Langford, A., Waldron, S., Saleh, H., others, 2021. Monitoring the COVID-19-affected indonesian seaweed industry using remote sensing data. Marine Policy 127, 104431. https://doi.org/10.1016/j.marpol.2021.104431
Msuya, F.E., Bolton, J., Pascal, F., Narrain, K., Nyonje, B., Cottier-Cook, E.J., 2022. Seaweed farming in africa: Current status and future potential. Journal of Applied Phycology 34, 985–1005. https://doi.org/10.1007/s10811-021-02676-w
Nurdin, N., Alevizos, E., Syamsuddin, R., Asis, H., Zainuddin, E.N., Aris, A., Oiry, S., Brunier, G., Komatsu, T., Barillé, L., 2023. Precision aquaculture drone mapping of the spatial distribution of kappaphycus alvarezii biomass and carrageenan. Remote Sensing 15, 3674. https://doi.org/10.3390/rs15143674
Nurdin, N., Aris, A., AS, M.A., 2025. Seasionality of kappaphycus alvarezii production trends in south sulawesi using UAV monitoring. Remote Sensing Applications: Society and Environment 101659. https://doi.org/10.1016/j.rsase.2025.101659
Oiry, S., Barillé, L., 2021. Using sentinel-2 satellite imagery to develop microphytobenthos-based water quality indices in estuaries. Ecological Indicators 121, 107184. https://doi.org/10.1016/j.ecolind.2020.107184
Oiry, S., Davies, B.F.R., Stiger-Pouvreau, V., Gernez, P., Barillé, L., 2025. Mapping the distribution of the alien invasive gracilaria vermiculophylla at the site of its first european introduction. Journal of Environmental Management 392, 126726. https://doi.org/10.1016/j.jenvman.2025.126726
Román, M., Davies, B.F., Rosa, P., Oiry, S., Gernez, P., Santiago, J.A., Olabarria, C., Barillé, L., 2026. From pixels to peaks: Integrating LiDAR and RGB drone imagery to map mussel spat on intertidal rocky shores. Estuarine, Coastal and Shelf Science 109671. https://doi.org/10.1016/j.ecss.2025.109671
Setyawidati, N., Liabot, P., Perrot, T., Radiarta, N., Deslandes, E., Bourgougnon, N., Rossi, N., Stiger-Pouvreau, V., 2017. In situ variability of carrageenan content and biomass in the cultivated red macroalga kappaphycus alvarezii with an estimation of its carrageenan stock at the scale of the malasoro bay (indonesia) using satellite image processing. Journal of Applied Phycology 29, 2307–2321. https://doi.org/10.1007/s10811-017-1200-9
Urbina-Barreto, I., Alevizos, E., Randrianary, T.M., Museux, M., Randriamaroson, R.A.M., Chauvin, A., Rakotoniaina, S., Jan, S., Barillé, L., Tribollet, A., 2026. Mapping coastal marine habitats with RGB and multispectral UAS imagery to support seaweed aquaculture management and ecosystem conservation. Drones 10, 276. https://doi.org/10.3390/drones10040276
Vadassery, N., Neish, I.C., 2024. Integration of precision technology into adaptive phyconomy systems for extensive tropical red seaweed farming, in: Tropical Phyconomy Coalition Development: Focus on Eucheumatoid Seaweeds. Springer Nature Switzerland, pp. 239–254. https://doi.org/10.1007/978-3-031-47806-2_19
Zhang, J., Langford, Z., Waldron, S., 2023. The global carrageenan industry, in: Globalisation and Livelihood Transformations in the Indonesian Seaweed Industry. Routledge, pp. 23–50. https://doi.org/10.4324/9781003183860-3
Citation
BibTeX citation:
@online{oiry2026,
  author = {Oiry, Simon and Jan, Sébastien and Museux, Manon and A.
    Mahandrisoa Randriamaroson, Ravo and , Anthony and Barillé, Laurent},
  title = {MadaKapPy: {A} Tool for in Situ Biomass Estimation of
    *Kappaphycus* Cultures},
  date = {2026-05-14},
  langid = {en},
  abstract = {To be Written}
}
For attribution, please cite this work as:
Oiry, S., Jan, S., Museux, M., A. Mahandrisoa Randriamaroson, R., A.,
Barillé, L., 2026. MadaKapPy: A tool for in situ biomass estimation of
*kappaphycus* cultures [WWW Document]. Remote Sensing of Environment.