Bourgneuf Bay
Bourgneuf Bay is a broad, shallow coastal bay situated on the French Atlantic coast, between the island of Noirmoutier and the mainland. Bordered by salt marshes, oyster farms, and mudflats, it is characterized by its extensive intertidal zones. The bay hosts large seagrass meadows, mainly composed of Zostera noltei, which cover wide areas of the seabed. These meadows are especially visible at low tide and stretch across the southern and western parts of the bay. As shown in Figure 1, the area considered in this study spans more than 23 km².
For this site, a time series combining images from the Landsat, SPOT, and Sentinel-2 missions has been used to monitor the seagrass meadow since 1985 (Table 1). This work was published by Zoffoli et al. (2021). The present work updates the time series from Zoffoli et al. (2021) by incorporating newly available images and computing additional metrics (see Methodology).
Date | Capteur | Date | Capteur | Date | Capteur |
|---|---|---|---|---|---|
septembre 13, 1985 | Landsat | septembre 24, 2002 | SPOT | septembre 30, 2015 | Sentinel-2 |
octobre 02, 1986 | Landsat | septembre 26, 2003 | SPOT | août 22, 2016 | Sentinel-2 |
juillet 26, 1987 | Landsat | septembre 17, 2004 | Landsat | octobre 06, 2017 | Sentinel-2 |
octobre 15, 1988 | SPOT | septembre 18, 2005 | SPOT | septembre 14, 2018 | Sentinel-2 |
septembre 04, 1990 | Landsat | septembre 23, 2006 | Landsat | septembre 16, 2019 | Sentinel-2 |
septembre 28, 1991 | SPOT | septembre 28, 2008 | Landsat | septembre 05, 2020 | Sentinel-2 |
septembre 20, 1993 | SPOT | septembre 08, 2009 | SPOT | septembre 23, 2021 | Sentinel-2 |
octobre 11, 1995 | Landsat | septembre 12, 2010 | SPOT | août 11, 2022 | Sentinel-2 |
septembre 07, 1997 | SPOT | octobre 02, 2011 | SPOT | septembre 03, 2023 | Sentinel-2 |
septembre 21, 1998 | SPOT | septembre 28, 2012 | SPOT | septembre 17, 2024 | Sentinel-2 |
septembre 02, 2001 | Landsat | octobre 05, 2013 | SPOT |
List of Satellite images used to follow the meadows in Bourngeuf Bay
Seagrass Percent Cover time series
Figure 2 is show the evolution of the Seagrass Cover over time, since 1985. The minimum density was recorded in 1988 with 28% of average cover, while the maximum density has been recorded in 2022 with 59% of average cover.
Historical seagrass patches of the meadow
Figure 3 shows the number of consecutive years, starting in 2024, during which each pixel maintained a Seagrass Percentage Cover (SPC) above 50% every single year. One area of the meadow, covering 3100 m², has sustained an SPC above 50% for the past 29 years. Within this area, 200 m² have maintained an SPC above 50% for over 34 consecutive years without interruption. This patch is centered around the coordinates y= 46.9593738 and x= -2.1710815.
Year of the maximum of cover
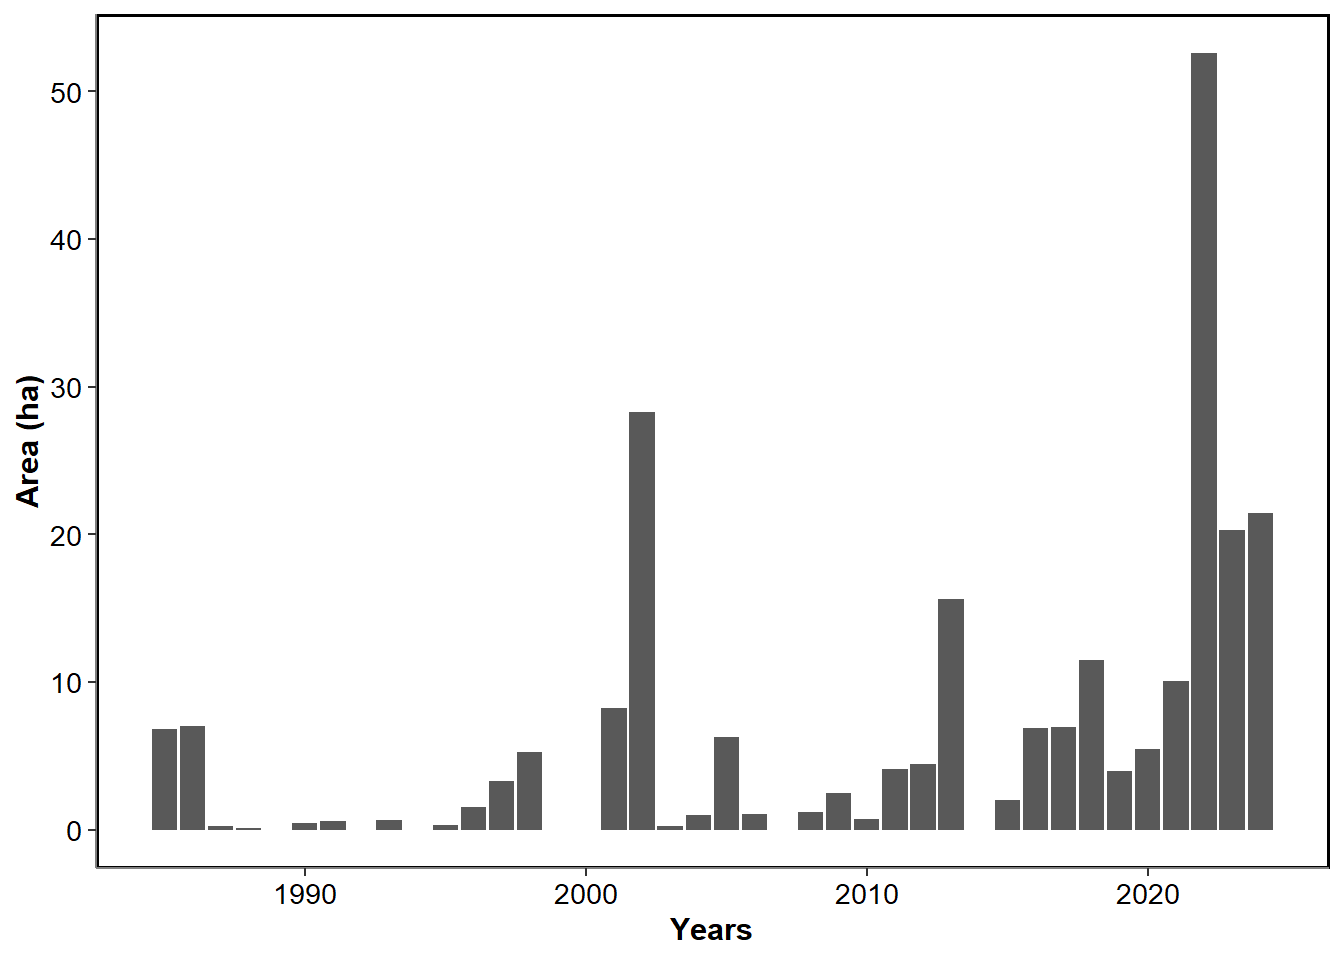
Figure 4 shows, for each pixel, the year when it reached its maximum Seagrass Percentage Cover (SPC). This same information is presented in Figure 5 as a histogram, where the area of meadow reaching its all-time maximum SPC is displayed for each year. Three key periods stand out: 1985–1986, 2002, and 2022. In 1985–1986, more than 15% of the meadow reached its highest SPC values in the time series. These are shown as red pixels in Figure 4, typically located along the edges of the meadow. In 2002, 28% of the meadow reached its historical maximum, corresponding to yellow areas in Figure 4, where the meadow expanded eastward and westward. Finally, in 2022, 52% of the meadow reached its highest recorded SPC, represented by blue areas in Figure 4, mainly located in the central part of the meadow.
Rate of decline since the date of maximum
Figure 6 shows the rate of decline in seagrass cover, expressed as percent cover lost per year, since the year of maximum SPC indicated in Figure 4. On average, the meadow has been losing 1.78% of its seagrass cover per year since reaching its maximum. However, certain areas located in the central part of the meadow—likely where fishermen regularly carry out clam fishing activities—are experiencing much sharper declines, with rates reaching up to 25% per year.
Amount of time above 50% since the start of the time serie
Figure 7 shows the proportion of time each pixel maintained an SPC value above 50%. Most of the meadow displays SPC values above this threshold between 50% and 60% of the time. More stable areas, where SPC exceeded 50% more than 80–90% of the time, are found in restricted zones within the main meadow (around 46.960679, -2.172888). In the northwestern part of the meadow, near the seaport of Noirmoutier-en-l’Île, no pixel exceeds the 60% frequency. Finally, the southernmost meadow, located near the Gois, shows low frequencies, with SPC values above 50% reached only about 30% of the time.