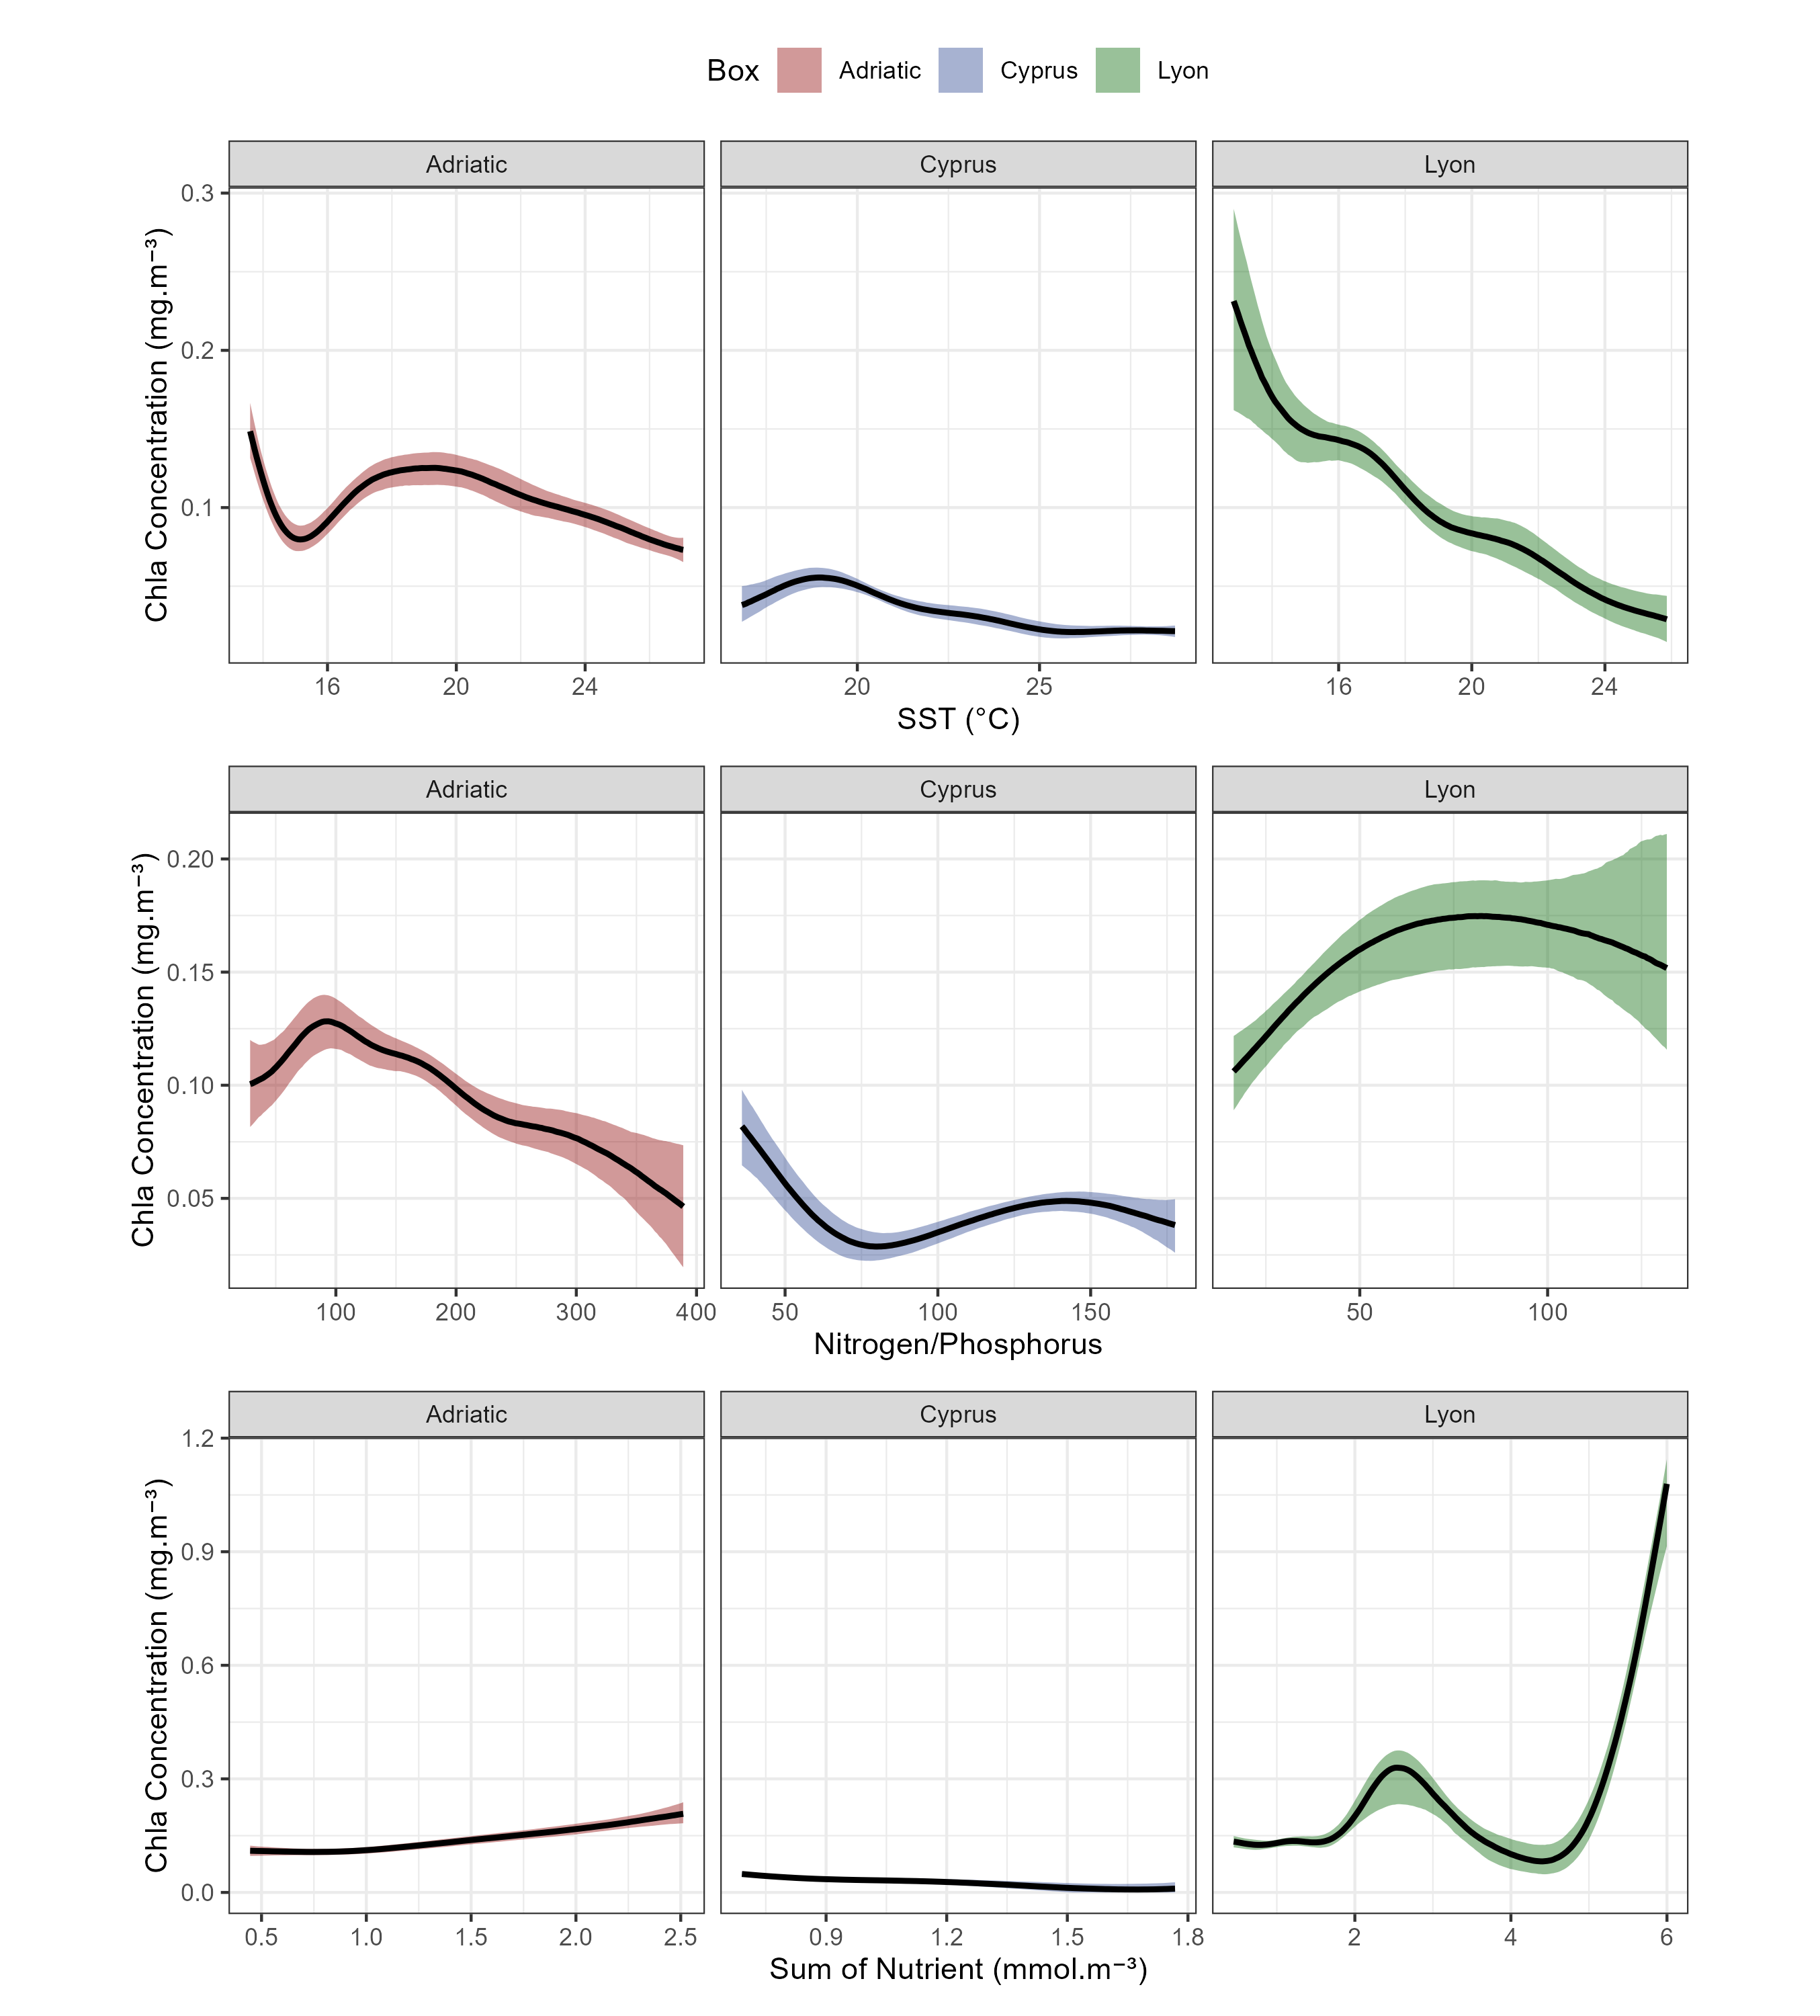
Figure 1: Smooth relationships between chlorophyll-a concentration (mg m⁻³) and key environmental drivers of the month before in three study areas. Panels are arranged by predictor variable (rows) and location (columns): (top) sea surface temperature (SST, °C), (middle) nitrogen∕phosphorus ratio (N∕P), and (bottom) total inorganic nutrient load (mmol m⁻³); (left) northern Adriatic Sea, (center) Cyprus coastal waters, and (right) Gulf of Lyon. Black lines represent GAM‐estimated smoothers and shaded bands denote 95% confidence intervals. Conditional effects of each predictor were obtained by holding the other two variables at their mean values.