Conditional effect of each variable of the Chlorophyll
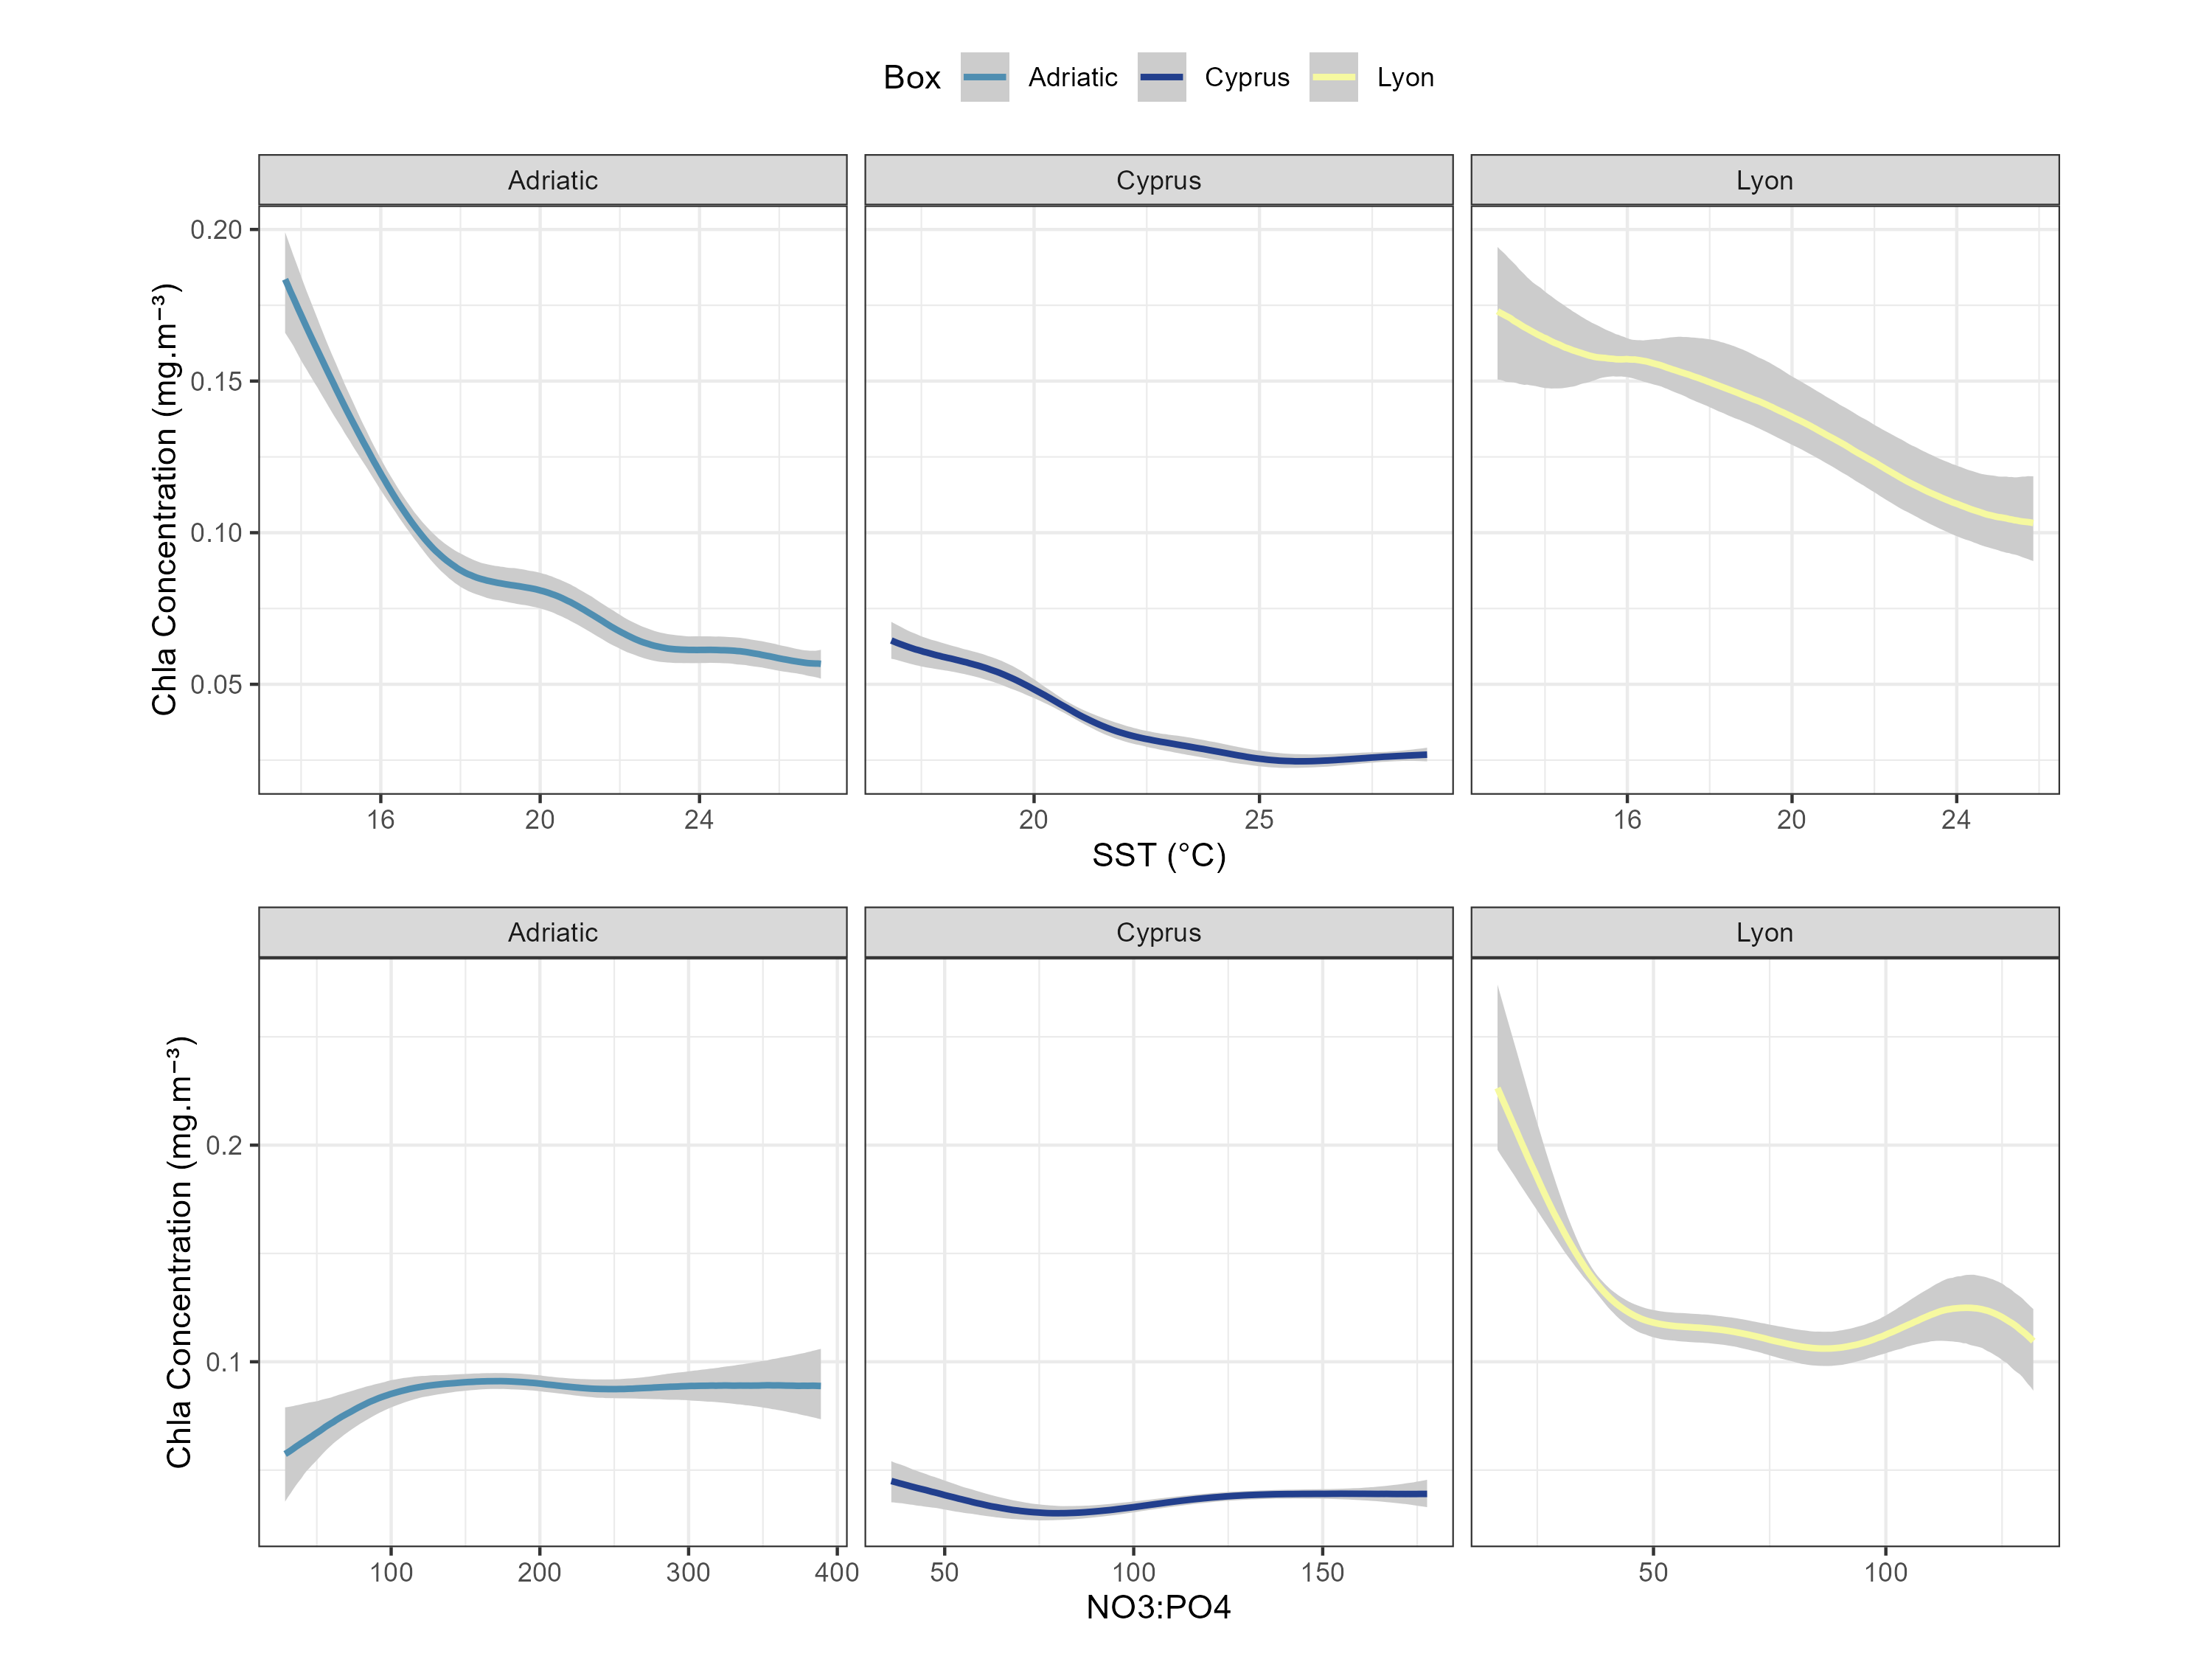
Figure 1: Smooth relationships between chlorophyll-a concentration (mg m⁻³) and key environmental drivers in three study areas. Panels are arranged by predictor variable (rows) and location (columns): (top) sea surface temperature (SST, °C), (bottom) nitrogen∕phosphorus ratio (N∕P); (left) northern Adriatic Sea, (center) Cyprus coastal waters, and (right) Gulf of Lyon. Lines represent GAM‐estimated smoothers and shaded bands denote 95% confidence intervals. Conditional effects of each predictor were obtained by holding the other variable to its mean value.
Interactions between Variables
SST vs Nitrogen / Phosphorus
Lyon
Figure 2: Three‐dimensional GAM response surface showing predicted chlorophyll-a concentration (mg m⁻³) in the Gulf of Lyon as a function of sea‐surface temperature (SST, °C) and nitrogen∕phosphorus ratio (N∕P), with total nutrient load held constant at its long‐term mean. Surface height corresponds to the model’s fitted chlorophyll-a values, while the color scale (“Error”) encodes the width of the 95 % confidence.
Adriatic
Figure 3: Three‐dimensional GAM response surface showing predicted chlorophyll-a concentration (mg m⁻³) in the Adriatic as a function of sea‐surface temperature (SST, °C) and nitrogen∕phosphorus ratio (N∕P), with total nutrient load held constant at its long‐term mean. Surface height corresponds to the model’s fitted chlorophyll-a values, while the color scale (“Error”) encodes the width of the 95 % confidence.
Cyprus
Figure 4: Three‐dimensional GAM response surface showing predicted chlorophyll-a concentration (mg m⁻³) in Cyprus as a function of sea‐surface temperature (SST, °C) and nitrogen∕phosphorus ratio (N∕P), with total nutrient load held constant at its long‐term mean. Surface height corresponds to the model’s fitted chlorophyll-a values, while the color scale (“Error”) encodes the width of the 95 % confidence.
Nutrient Load vs Nitrogen / Phosphorus
Lyon
Figure 5: Three‐dimensional GAM response surface showing predicted chlorophyll-a concentration (mg m⁻³) in Gulf of Lyon as a function of Total nutrient load (sum_Nutri, mmol.m⁻³) and nitrogen∕phosphorus ratio (N∕P), with the SST held constant at its long‐term mean. Surface height corresponds to the model’s fitted chlorophyll-a values, while the color scale (“Error”) encodes the width of the 95 % confidence.
Adriatic
Figure 6: Three‐dimensional GAM response surface showing predicted chlorophyll-a concentration (mg m⁻³) in the Adriatic sea as a function of Total nutrient load (sum_Nutri, mmol.m⁻³) and nitrogen∕phosphorus ratio (N∕P), with the SST held constant at its long‐term mean. Surface height corresponds to the model’s fitted chlorophyll-a values, while the color scale (“Error”) encodes the width of the 95 % confidence.
Cyprus
Figure 7: Three‐dimensional GAM response surface showing predicted chlorophyll-a concentration (mg m⁻³) in Cyprus as a function of Total nutrient load (sum_Nutri, mmol.m⁻³) and nitrogen∕phosphorus ratio (N∕P), with the SST held constant at its long‐term mean. Surface height corresponds to the model’s fitted chlorophyll-a values, while the color scale (“Error”) encodes the width of the 95 % confidence.